Open Access
Fig. D.1
Download original image
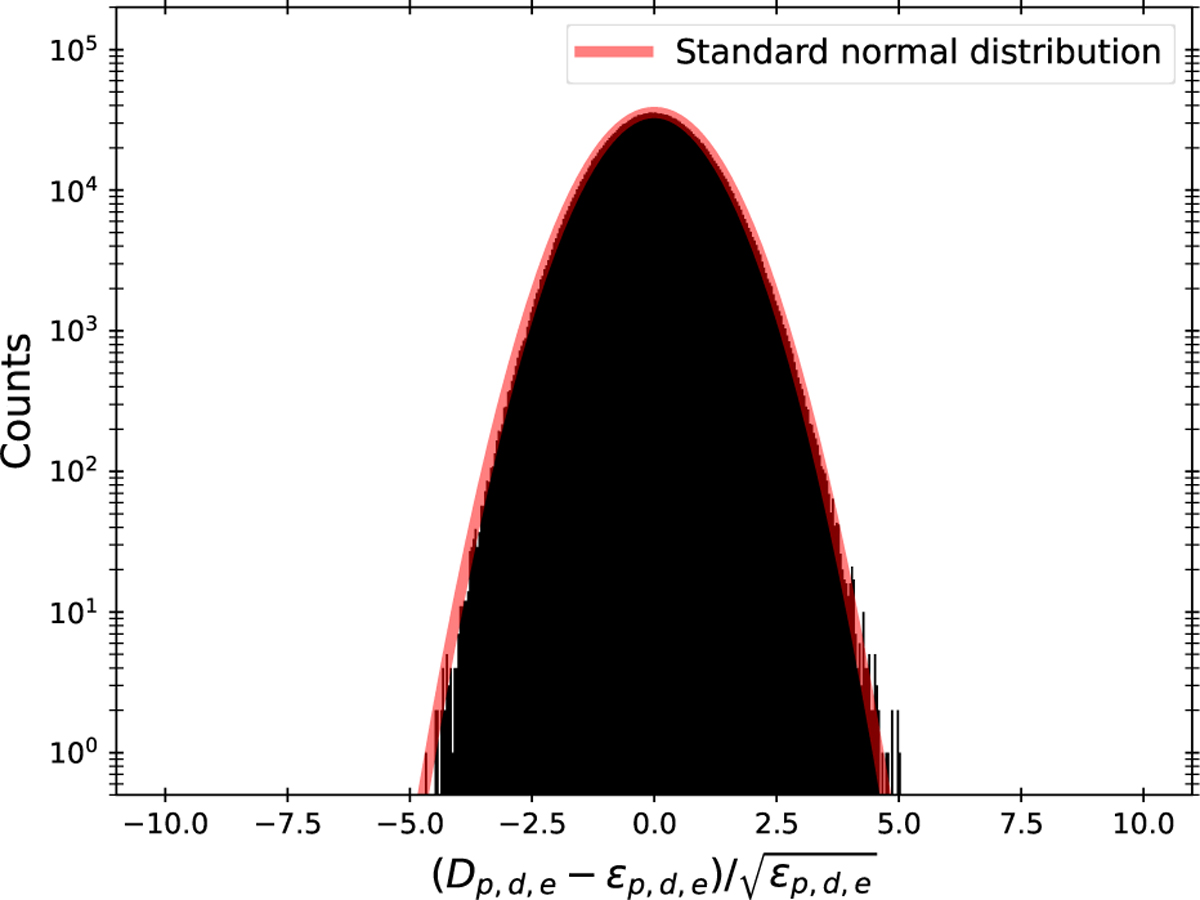
Distribution of normalized residuals ![]() , where Dp,d,e is the observed count and ϵp,d,e is the expected count from the reconstructed image and background normalization. The solid red line shows a standard normal distribution for comparison.
, where Dp,d,e is the observed count and ϵp,d,e is the expected count from the reconstructed image and background normalization. The solid red line shows a standard normal distribution for comparison.
Current usage metrics show cumulative count of Article Views (full-text article views including HTML views, PDF and ePub downloads, according to the available data) and Abstracts Views on Vision4Press platform.
Data correspond to usage on the plateform after 2015. The current usage metrics is available 48-96 hours after online publication and is updated daily on week days.
Initial download of the metrics may take a while.