Fig. 2.
Download original image
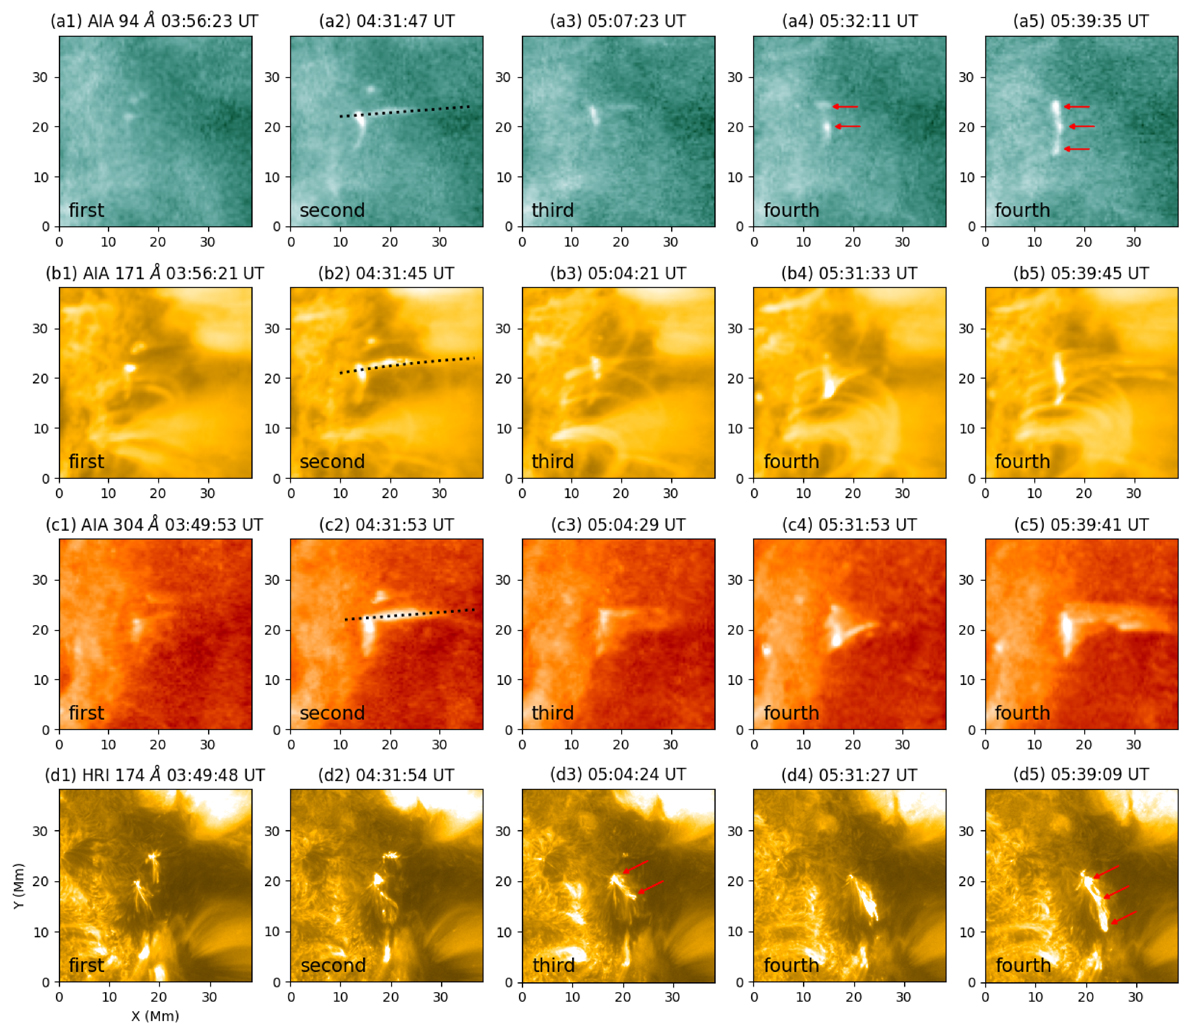
SDO/AIA 94 Å (panels a1−a5), 171 Å (panels b1−b5), 304 Å (panels c1−c5), and SO/EUI-HRI 174 Å (panels d1−d5) images showing the recurrent jets during their four eruptions. The dotted lines in the second column indicate the positions where the slices are taken, and the temporal evolution of these slices is shown in Fig. 3. The red arrows in panels (a4), (a5), (d3), and (d5) indicate the bright kernels at the jet base.
Current usage metrics show cumulative count of Article Views (full-text article views including HTML views, PDF and ePub downloads, according to the available data) and Abstracts Views on Vision4Press platform.
Data correspond to usage on the plateform after 2015. The current usage metrics is available 48-96 hours after online publication and is updated daily on week days.
Initial download of the metrics may take a while.