Fig. 4.
Download original image
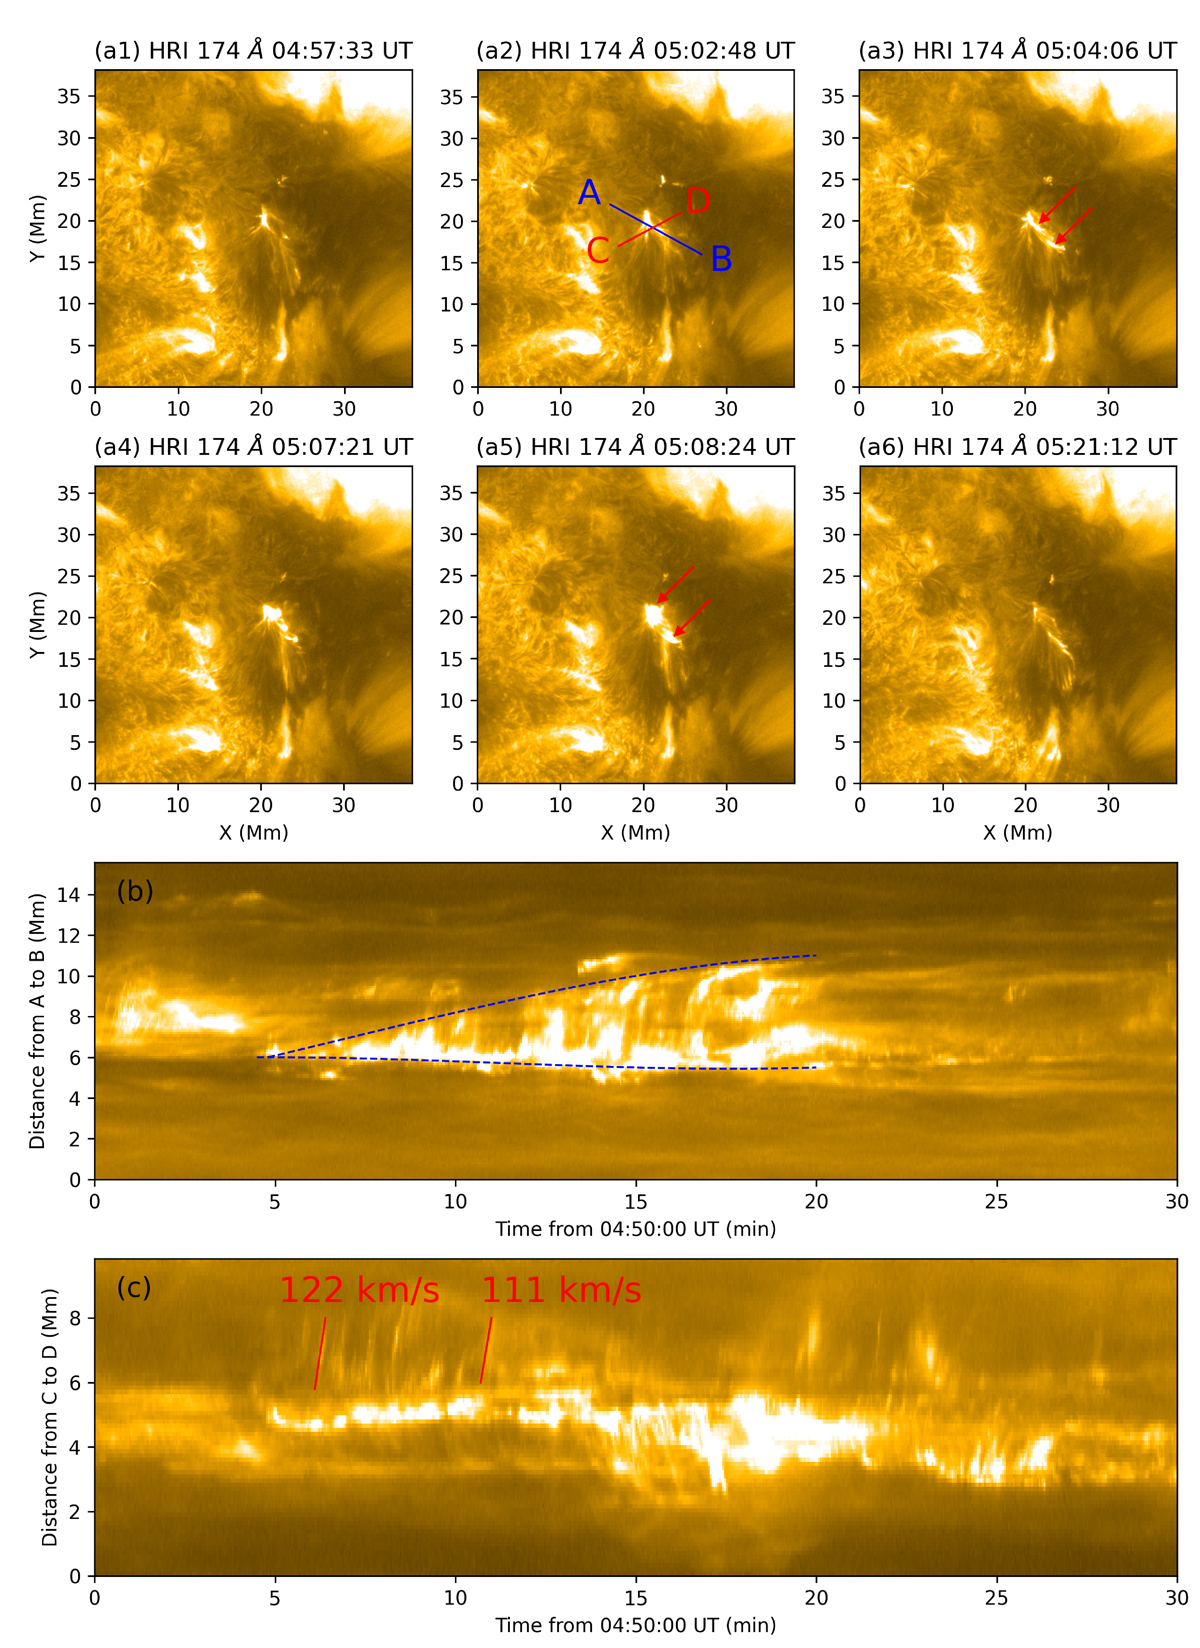
Panels (a1)−(a6): SO/EUI-HRI 174 Å images showing the evolution of the third eruption of the recurrent jets. In panels (a3) and (a5), the red arrows denote two bright points. Panel (b): Temporal evolution along the position indicated by the “A–B” line in panel (a3). Panel (c): Time–distance plot along the position marked by the “C–D” line in panel (a3).
Current usage metrics show cumulative count of Article Views (full-text article views including HTML views, PDF and ePub downloads, according to the available data) and Abstracts Views on Vision4Press platform.
Data correspond to usage on the plateform after 2015. The current usage metrics is available 48-96 hours after online publication and is updated daily on week days.
Initial download of the metrics may take a while.