Fig. 5.
Download original image
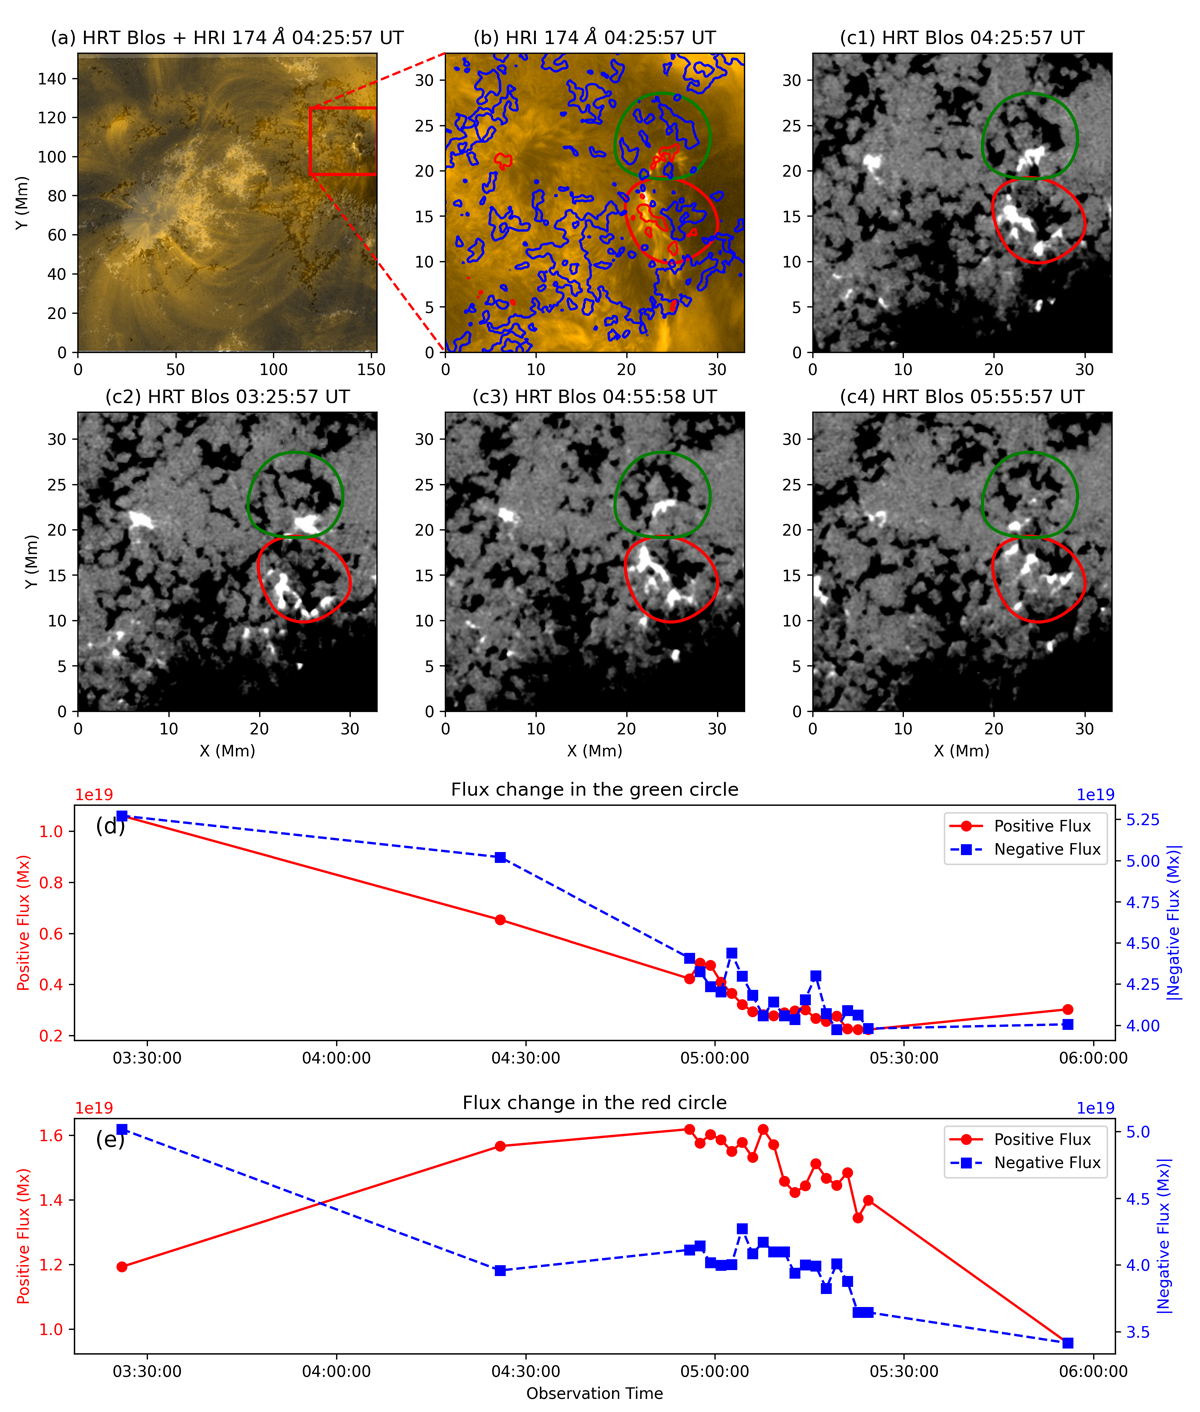
Evolution of the magnetic structures at the footpoints of the recurrent jets. Panel (a): SO/PHI-HRT BLOS map overlaid with SO/EUI-HRI 174 Å images of the entire AR. The red square outlines the subfield (in the subsequent panels) where the recurrent jets occur. Panel (b): SO/EUI-HRI 174 Å image cropped to the red-boxed region in (a). Panel (c1): Co-spatial SO/PHI-HRT magnetogram of the same subfield. Panels (c2)–(c4): Temporal sequence of magnetograms, showing the evolution of the magnetic field in the jet footpoint regions. The green and red circles enclose the northern and southern jets, respectively. These regions were chosen to remain as isolated as possible from surrounding flux concentrations. Panels (d) and (e): Time series of the magnetic flux calculated within the green and red circles, respectively, illustrating the flux changes in the two jet footpoint regions.
Current usage metrics show cumulative count of Article Views (full-text article views including HTML views, PDF and ePub downloads, according to the available data) and Abstracts Views on Vision4Press platform.
Data correspond to usage on the plateform after 2015. The current usage metrics is available 48-96 hours after online publication and is updated daily on week days.
Initial download of the metrics may take a while.