Fig. 6.
Download original image
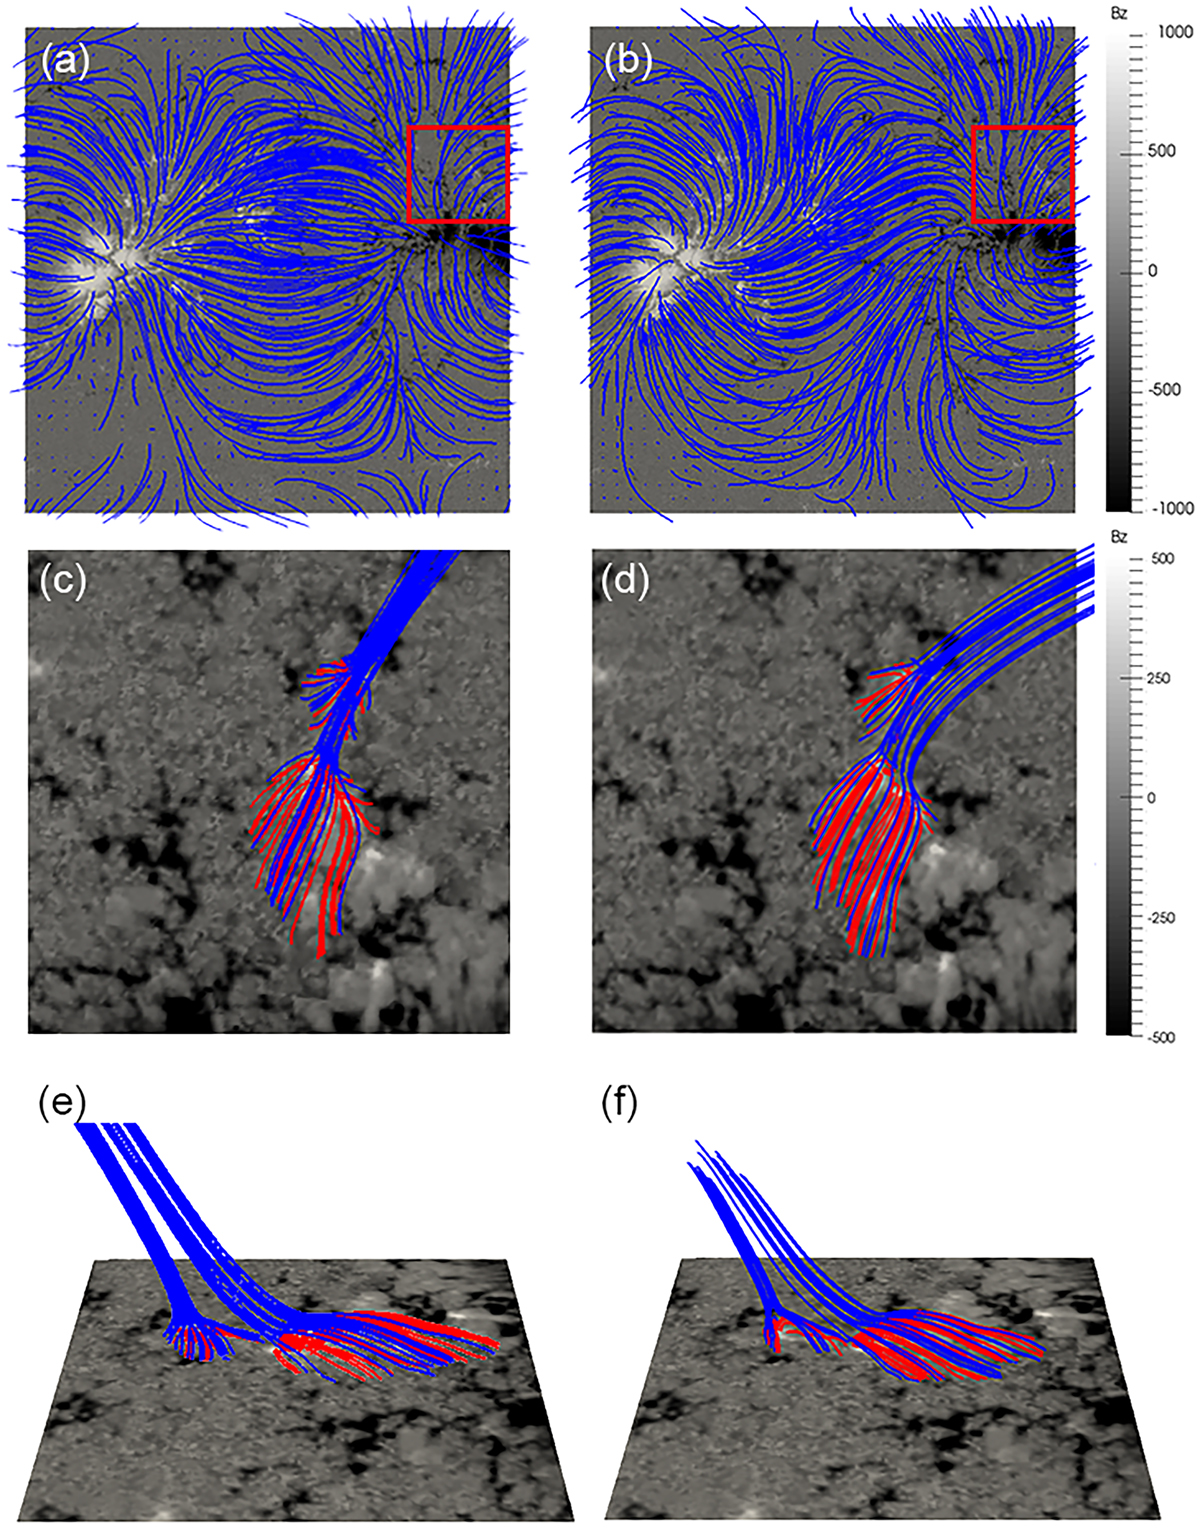
Potential field extrapolation (left panels) and linear MHS field extrapolation (right panels) based on the SO/PHI-HRT vector magnetic field data at 05:04:19 UT. Panels (a) and (b): Top views, with magnetic field lines marked in blue. Panels (c) and (d): Top view of the magnetic field structures of the jets, within the FOV outlined by the red squares in the top panels. Panels (e) and (f): Side views of the magnetic field structures of the jets. In panels (c)–(f), the blue curves represent open field lines, and the red curves represent closed field lines.
Current usage metrics show cumulative count of Article Views (full-text article views including HTML views, PDF and ePub downloads, according to the available data) and Abstracts Views on Vision4Press platform.
Data correspond to usage on the plateform after 2015. The current usage metrics is available 48-96 hours after online publication and is updated daily on week days.
Initial download of the metrics may take a while.