Fig. 7.
Download original image
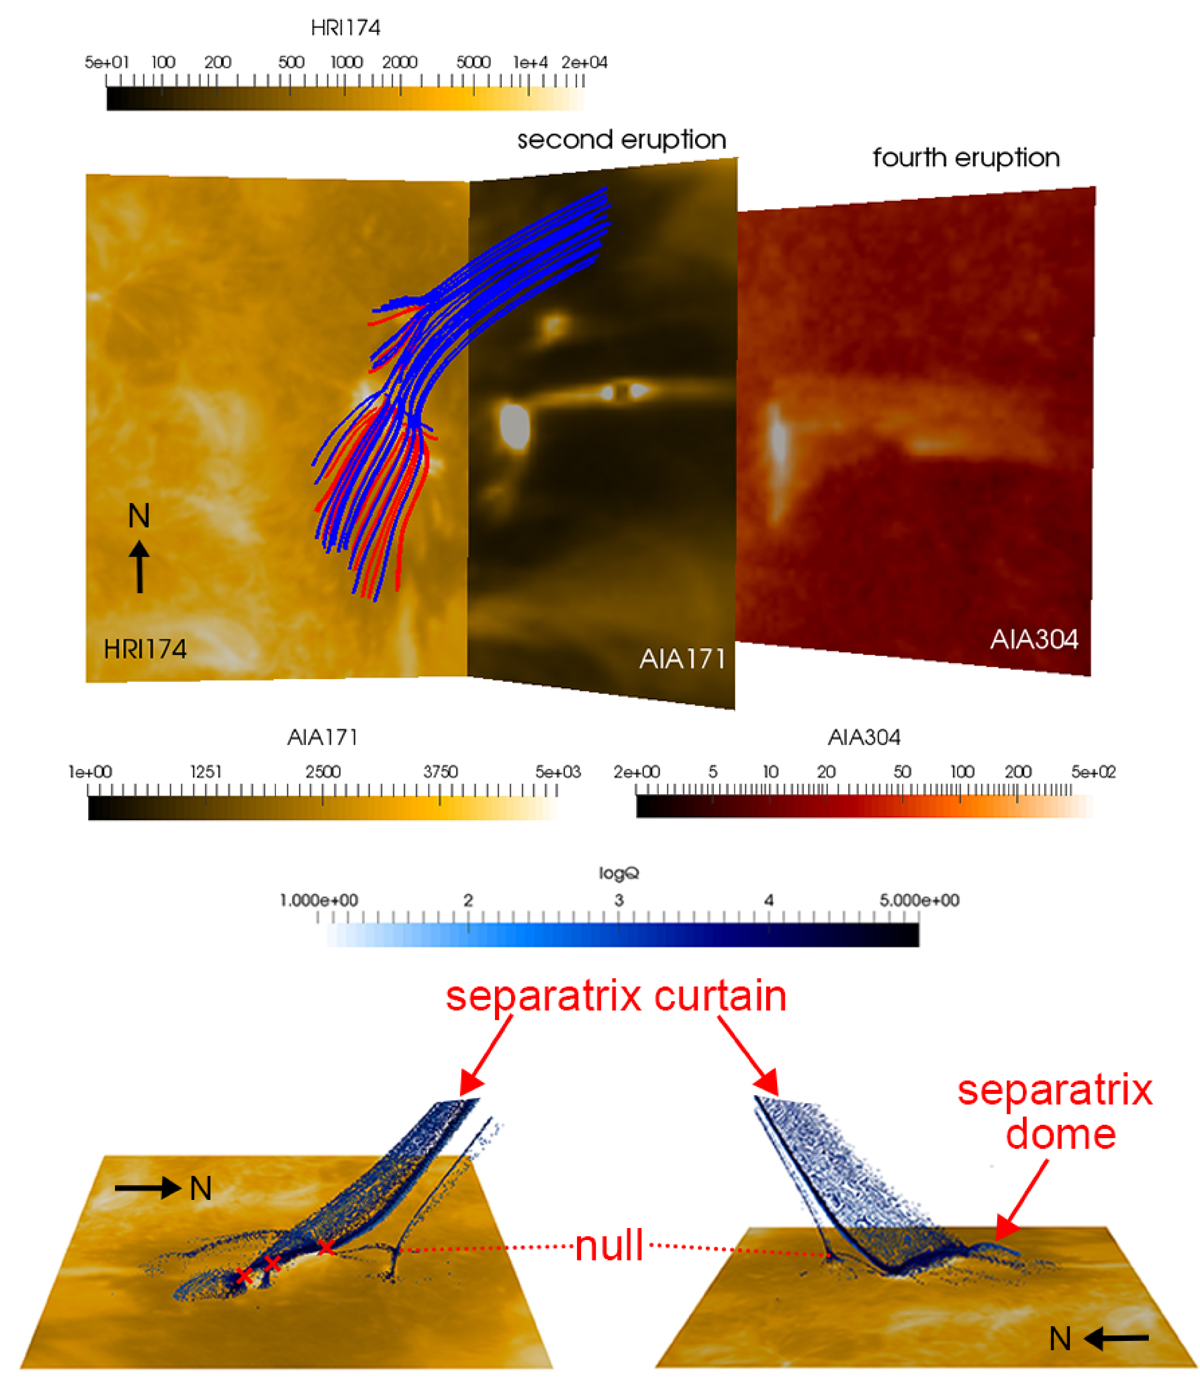
Linear MHS field extrapolation corresponding to Fig. 6d, overlaid on a SO/EUI-HRI 174 Å base image at 05:04:19 UT. In the upper panel, blue and red curves denote open and closed magnetic field lines, respectively. The right side displays the SDO/AIA 171 Å image at 04:31:47 UT of the second jet eruption and the SDO/AIA 304 Å at 05:39:41 UT of the fourth jet eruption, providing a stereoscopic perspective of the jet’s 3D geometry. The lower panels show the side views of the high-Q regions (log Q > 5) from the MHS extrapolation. The red crosses mark the null points associated with the southern jet.
Current usage metrics show cumulative count of Article Views (full-text article views including HTML views, PDF and ePub downloads, according to the available data) and Abstracts Views on Vision4Press platform.
Data correspond to usage on the plateform after 2015. The current usage metrics is available 48-96 hours after online publication and is updated daily on week days.
Initial download of the metrics may take a while.