Fig. 8
Download original image
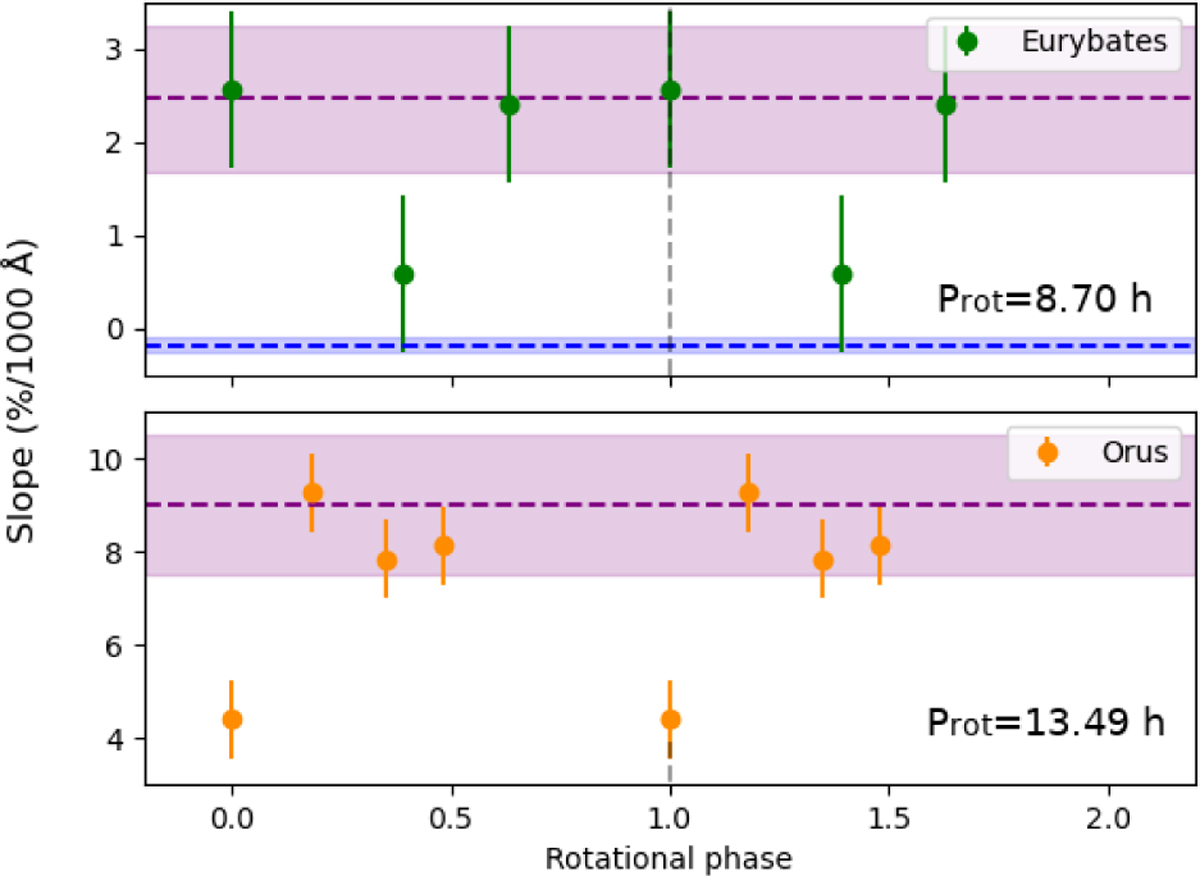
Spectral slope versus rotational phase for Eurybates and Orus. The purple area and the dashed line represent the spectral slope value with its uncertainty, as measured by Gaia. The spectral slope values derived by Souza-Feliciano et al. (2020) are represented in green and orange for Eurybates and Orus, respectively. In the top panel, the blue region represents the spectral slope obtained by Fornasier et al. (2007).
Current usage metrics show cumulative count of Article Views (full-text article views including HTML views, PDF and ePub downloads, according to the available data) and Abstracts Views on Vision4Press platform.
Data correspond to usage on the plateform after 2015. The current usage metrics is available 48-96 hours after online publication and is updated daily on week days.
Initial download of the metrics may take a while.