Fig. 1.
Download original image
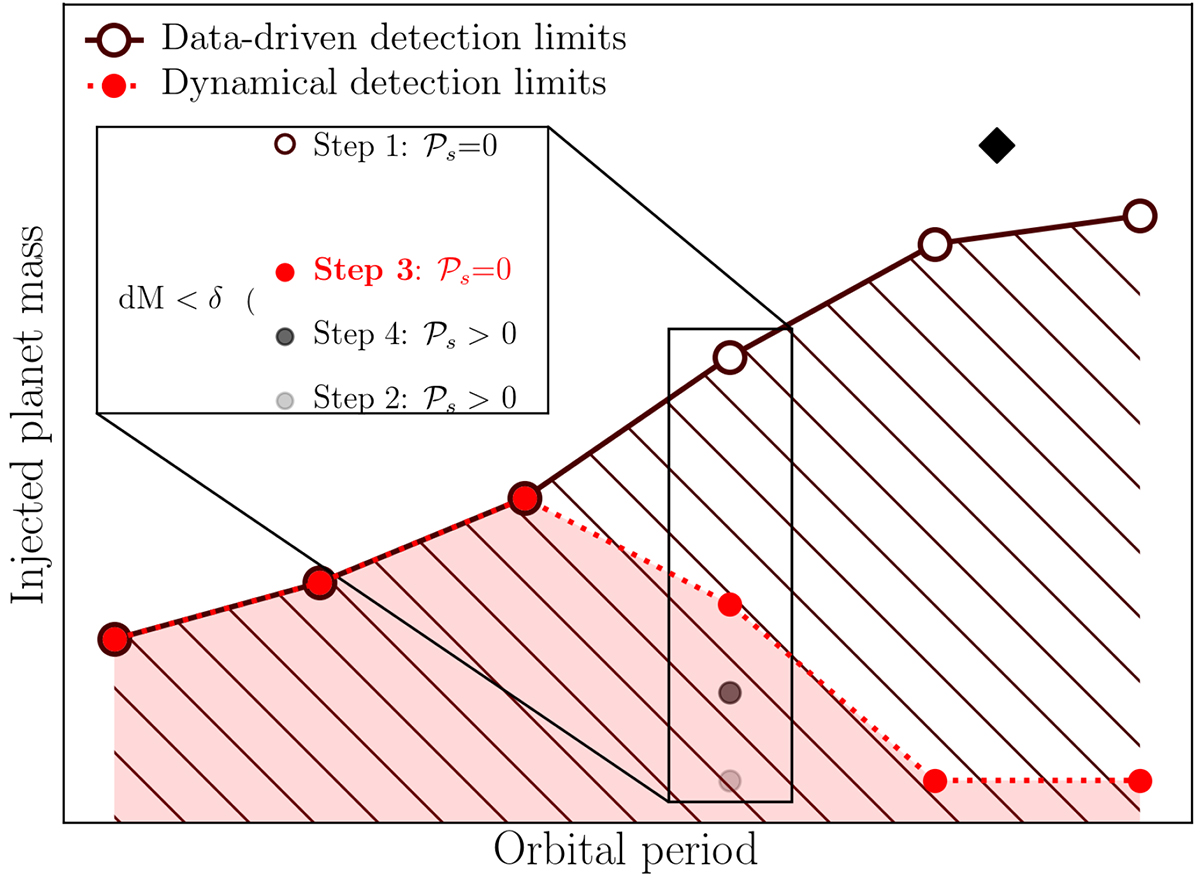
Schematics illustrating dynamical detection limits computation in ARDENT. Empty circles represent the data-driven detection limits, above which 𝒫d ∼ 1. ARDENT models the dynamical influence of known planets in the system (diamond symbol), inducing an instability zone where additional planets are excluded. The resulting dynamical detection limits are shown in red. The inner panel illustrates the iterative mass limits update accounting for stability, with dM the difference in injected mass between two consecutive steps and δ the precision threshold (cf. Sect. 2.3.1).
Current usage metrics show cumulative count of Article Views (full-text article views including HTML views, PDF and ePub downloads, according to the available data) and Abstracts Views on Vision4Press platform.
Data correspond to usage on the plateform after 2015. The current usage metrics is available 48-96 hours after online publication and is updated daily on week days.
Initial download of the metrics may take a while.