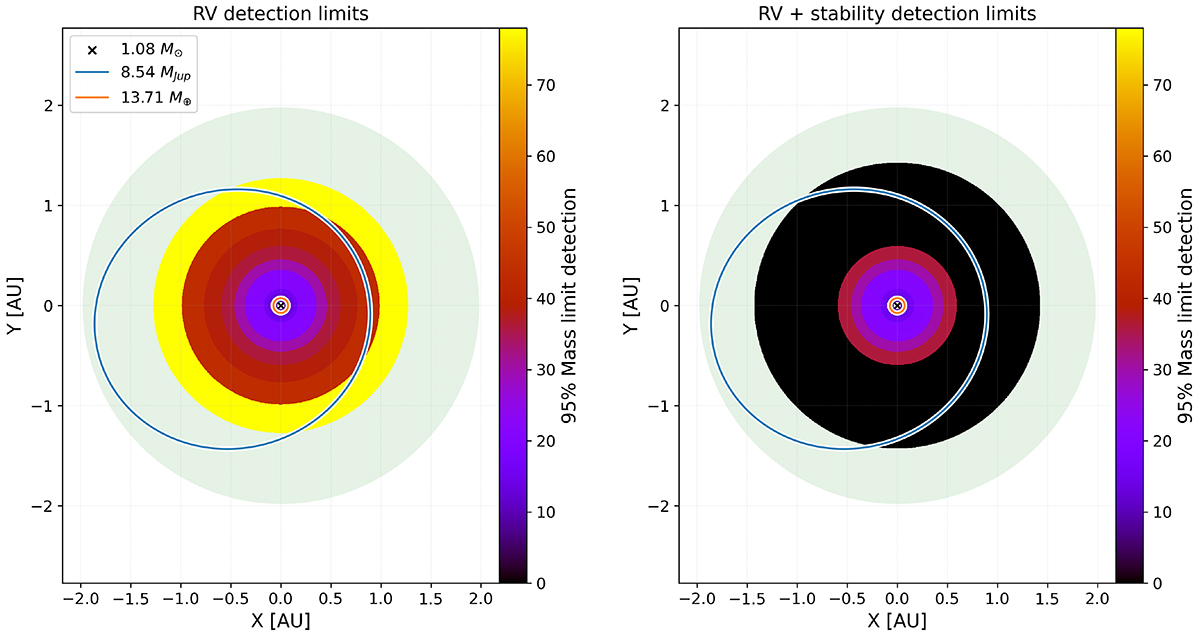
Fig. D.1.
Download original image
TOI-1736 detection limits presented in the orbital plane. The star and the two known planetary orbits are represented. The green shaded region is the predictive habitable zone, whose extent is computed from Kopparapu et al. (2013). The concentric discs illustrate the detection limits, with a colour code depicting the 95% limit mass. Left: Data-driven detection limits, based on the SOPHIE RVs only. Right: Dynamical detection limits, which add the constraint of orbital stability.
Current usage metrics show cumulative count of Article Views (full-text article views including HTML views, PDF and ePub downloads, according to the available data) and Abstracts Views on Vision4Press platform.
Data correspond to usage on the plateform after 2015. The current usage metrics is available 48-96 hours after online publication and is updated daily on week days.
Initial download of the metrics may take a while.