Open Access
Fig. 2.
Download original image
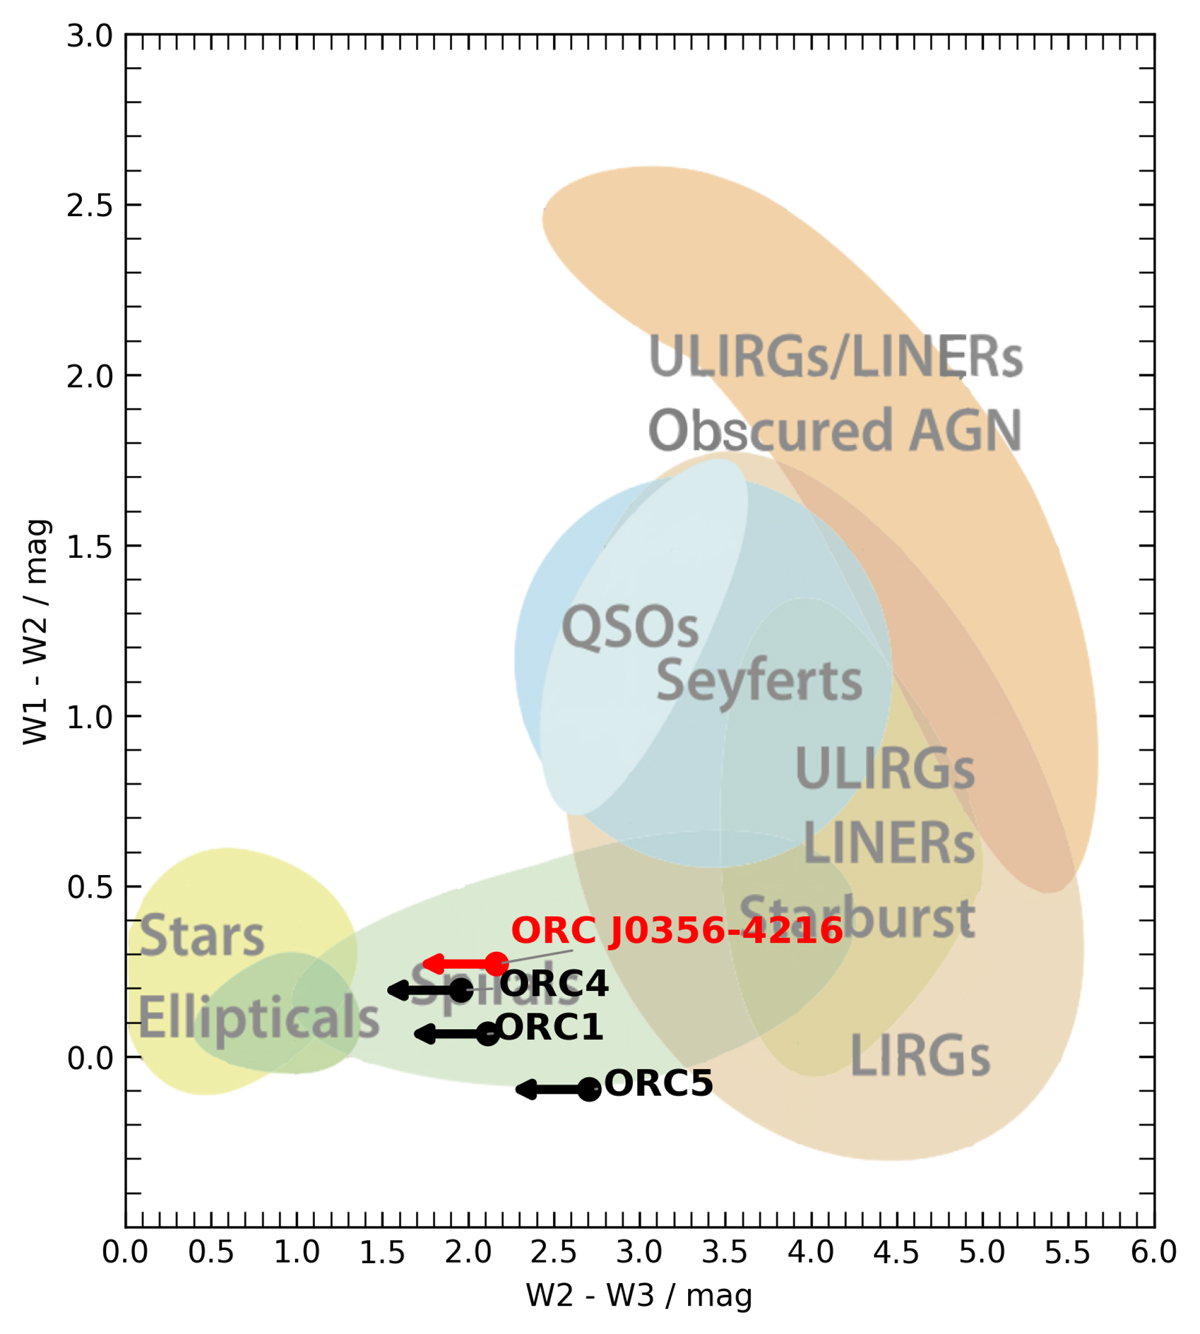
WISE colour–colour diagram showing in the background the locations of classes of objects (Wright et al. 2010), while showing the different detected ORCs. The WISE W1, W2, and W3 bands are 3.4 μm, 4.6 μm, and 12 μm, respectively. Arrows indicate the upper limits.
Current usage metrics show cumulative count of Article Views (full-text article views including HTML views, PDF and ePub downloads, according to the available data) and Abstracts Views on Vision4Press platform.
Data correspond to usage on the plateform after 2015. The current usage metrics is available 48-96 hours after online publication and is updated daily on week days.
Initial download of the metrics may take a while.