Fig. 3.
Download original image
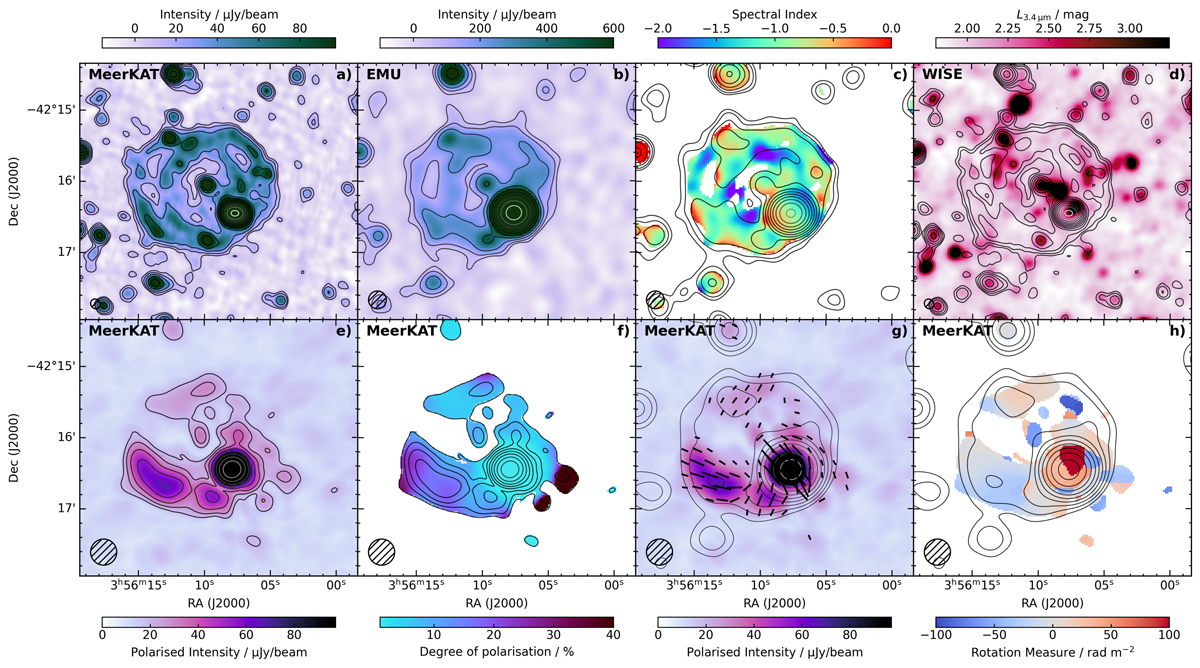
Overview of the relevant radio continuum polarimetry parameters of ORC J0356–4216. Panel a: Total intensity emission of MeerKAT data at central frequency of 1.28 GHz and bandwidth of 0.758 GHz with overlaid contours starting at 3σ and increasing by factor of two (σ = 3 μJy/beam). The beam of 8.57″ × 7.65″ appears in the lower left corner. Panel b: Total intensity emission of EMU data at central frequency of 943 MHz and bandwidth of 0.288 MHz with overlaid contours starting at 3σ and increasing by a factor of two (σ = 20 μJy/beam). A circular beam of 15″ appears in the lower left corner. Panel c: Two-point total spectral index map between the EMU data of 943 MHz and MeerKAT data of 1280 MHz with overlaid contours starting at 3σ and increasing by a factor of two (σ = 5.5 μJy/beam). The circular beam of 15″ appears in the lower left corner. Panel d: WISE 3.4 μm map with overlaid contours of the MeerKAT 1.28 GHz emission, starting at 3σ and increasing by factor of two (σ = 3 μJy/beam). The beam of 8.57″ × 7.65″ appears in the lower left corner. Panel e: Polarised intensity emission of MeerKAT data at central frequency of 1.28 GHz. The contours drawn make use of the signal-to-noise map, starting then at a factor 7 and increase by ![]() . The circular beam of 22″ appears in the lower left corner. Panel f: Fractional polarisation of MeerKAT data at central frequency of 1.28 GHz with the same overlaid contours from the polarised intensity map. The contours drawn make use of the S/N map, starting at a factor of 7 and increasing by
. The circular beam of 22″ appears in the lower left corner. Panel f: Fractional polarisation of MeerKAT data at central frequency of 1.28 GHz with the same overlaid contours from the polarised intensity map. The contours drawn make use of the S/N map, starting at a factor of 7 and increasing by ![]() . The circular beam of 22″ appears in the lower left corner. Panel g: Polarised intensity emission of MeerKAT data at central frequency of 1.28 GHz with overlaid total intensity emission at 1.28 GHz contours starting at 3σ and increasing by a factor of two (σ = 30 μJy/beam). The magnetic field orientations are shown in black and scale with the polarised intensity. The circular beam of 22″ appears in the lower left corner. Panel h: Distribution of foreground-corrected RM of MeerKAT data at central frequency of 1.28 GHz with overlaid total intensity emission at 1.28 GHz contours starting at 3σ and increasing by a factor of two (σ = 30 μJy/beam). The circular beam of 22″ appears in the lower left corner.
. The circular beam of 22″ appears in the lower left corner. Panel g: Polarised intensity emission of MeerKAT data at central frequency of 1.28 GHz with overlaid total intensity emission at 1.28 GHz contours starting at 3σ and increasing by a factor of two (σ = 30 μJy/beam). The magnetic field orientations are shown in black and scale with the polarised intensity. The circular beam of 22″ appears in the lower left corner. Panel h: Distribution of foreground-corrected RM of MeerKAT data at central frequency of 1.28 GHz with overlaid total intensity emission at 1.28 GHz contours starting at 3σ and increasing by a factor of two (σ = 30 μJy/beam). The circular beam of 22″ appears in the lower left corner.
Current usage metrics show cumulative count of Article Views (full-text article views including HTML views, PDF and ePub downloads, according to the available data) and Abstracts Views on Vision4Press platform.
Data correspond to usage on the plateform after 2015. The current usage metrics is available 48-96 hours after online publication and is updated daily on week days.
Initial download of the metrics may take a while.