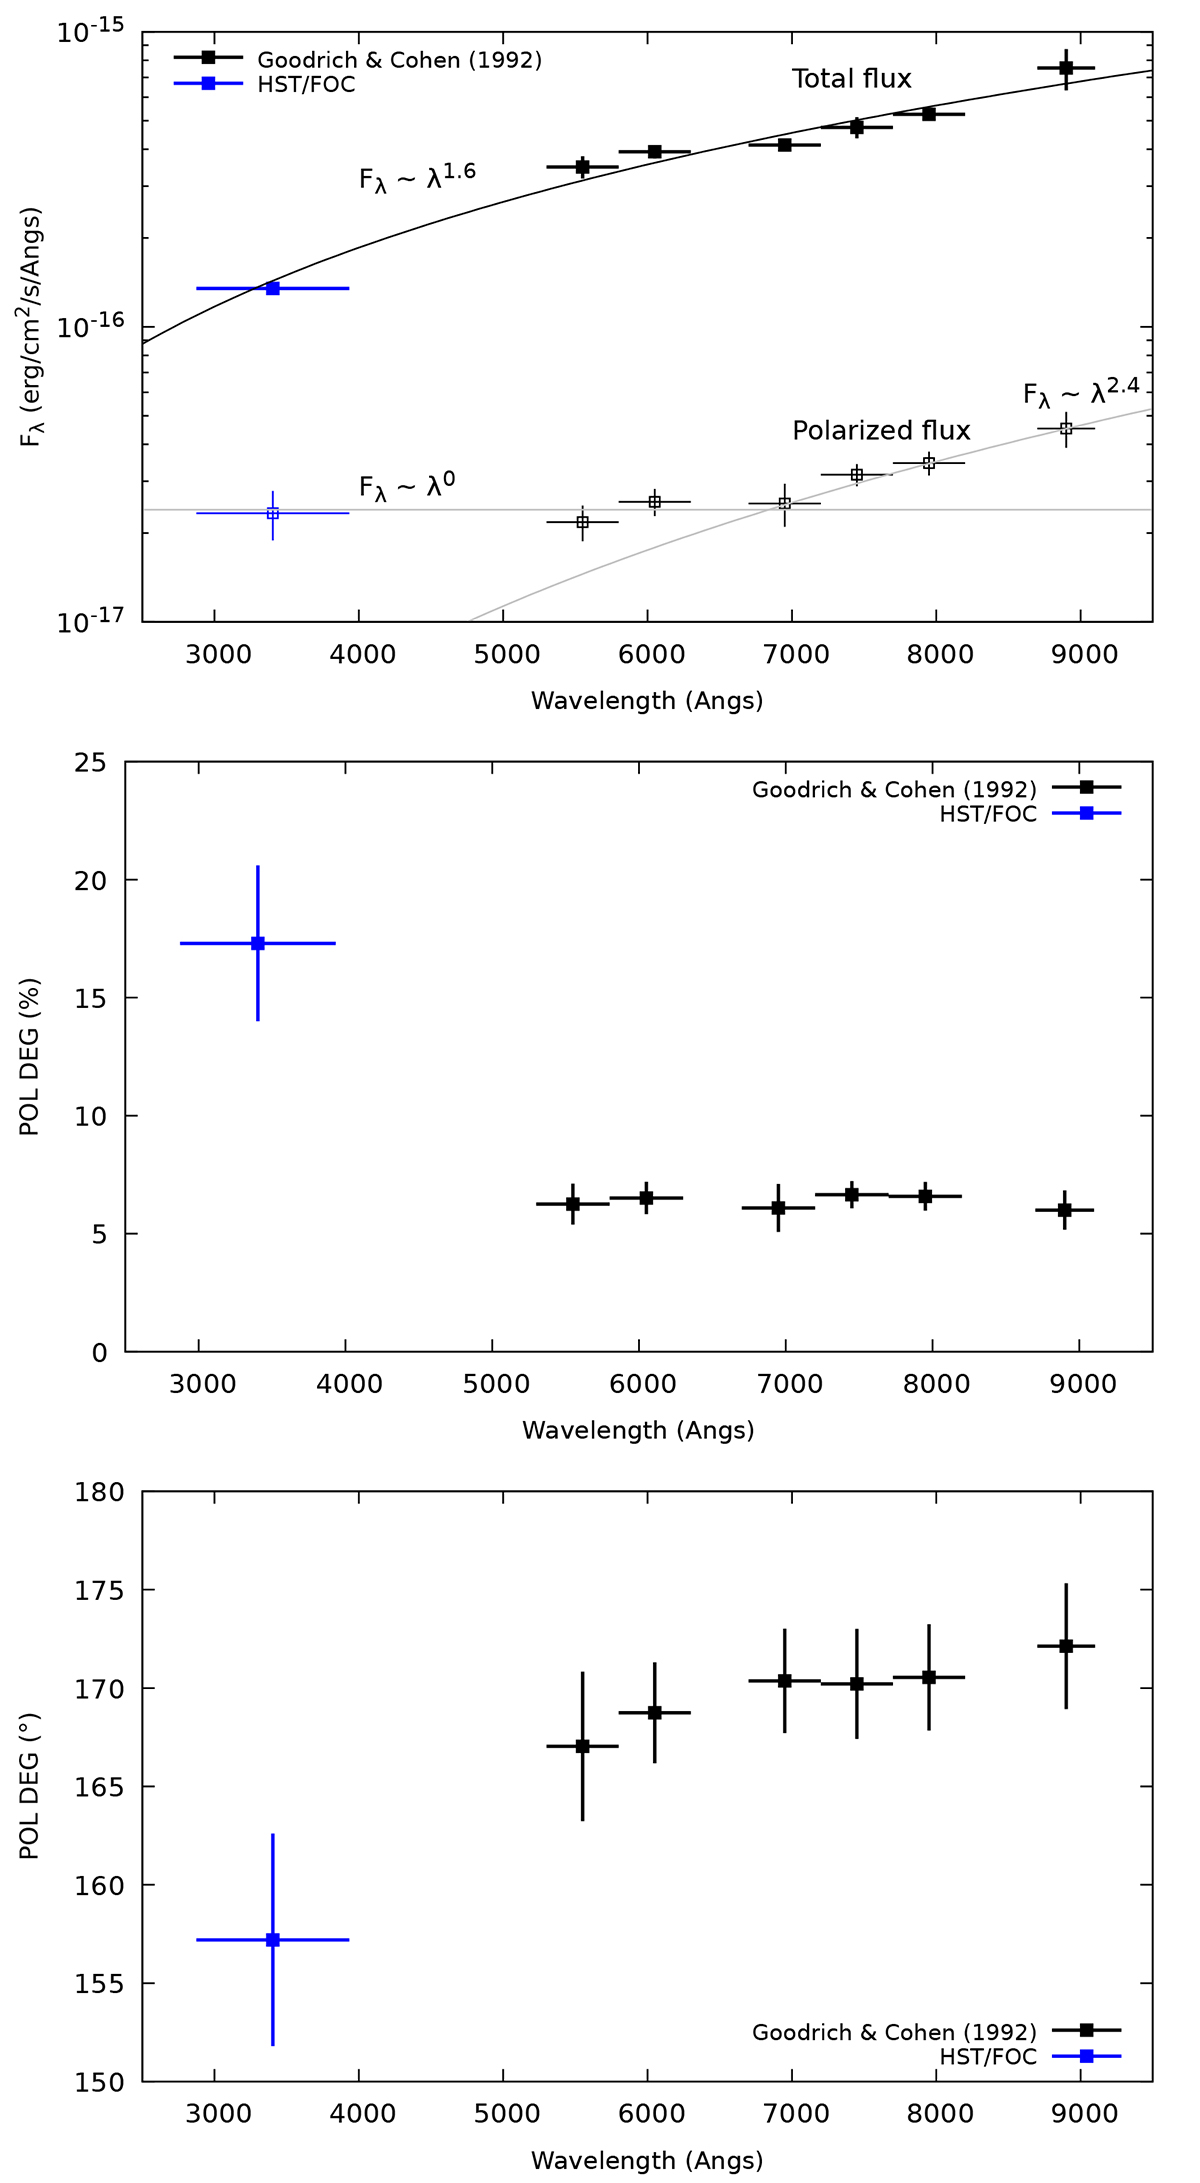
Fig. 6.
Download original image
Broadband polarimetry of 3C 109. The black points are from Goodrich & Cohen (1992), and the blue data are from our analysis. All data points were measured using a 2″ aperture. The top panel shows the total (filled squares) and polarized (empty squares) intensities as a function of wavelength. Power laws were fit to the total (black) and polarized (gray) intensities. The photon index α of each power law is indicated in the graph. The continuum linear polarization degrees (in percent) are shown in the middle panel, and the associated polarization position angles are shown in the bottom panel.
Current usage metrics show cumulative count of Article Views (full-text article views including HTML views, PDF and ePub downloads, according to the available data) and Abstracts Views on Vision4Press platform.
Data correspond to usage on the plateform after 2015. The current usage metrics is available 48-96 hours after online publication and is updated daily on week days.
Initial download of the metrics may take a while.