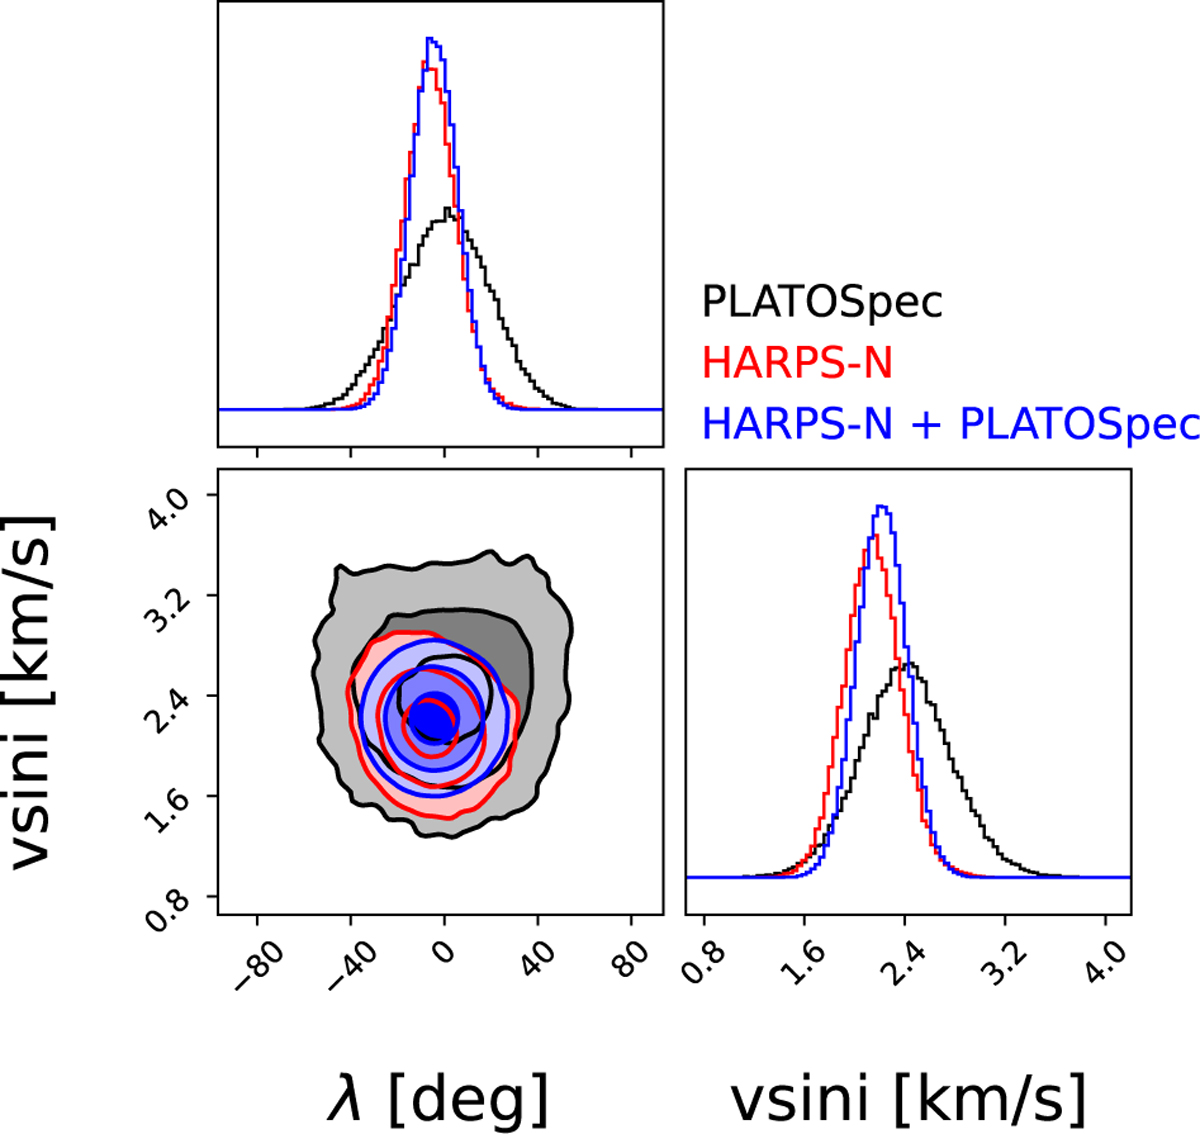
Fig. A2
Download original image
Corner plot for WASP-35b showing posteriors for two parameters, projected spin-orbit angle λ and projected rotational velocity of the star v sin i*. The contours show 1, 2 and 3σ deviations from the median. Data in red were obtained during a single transit with HARPS-N and presented in Zak et al. (2025a) while data in black are from two transits with the new PLATOSpec instrument. They show excellent agreement between the derived parameters. Data in blue are a joint fit of both datasets.
Current usage metrics show cumulative count of Article Views (full-text article views including HTML views, PDF and ePub downloads, according to the available data) and Abstracts Views on Vision4Press platform.
Data correspond to usage on the plateform after 2015. The current usage metrics is available 48-96 hours after online publication and is updated daily on week days.
Initial download of the metrics may take a while.