Open Access
Fig. A.1.
Download original image
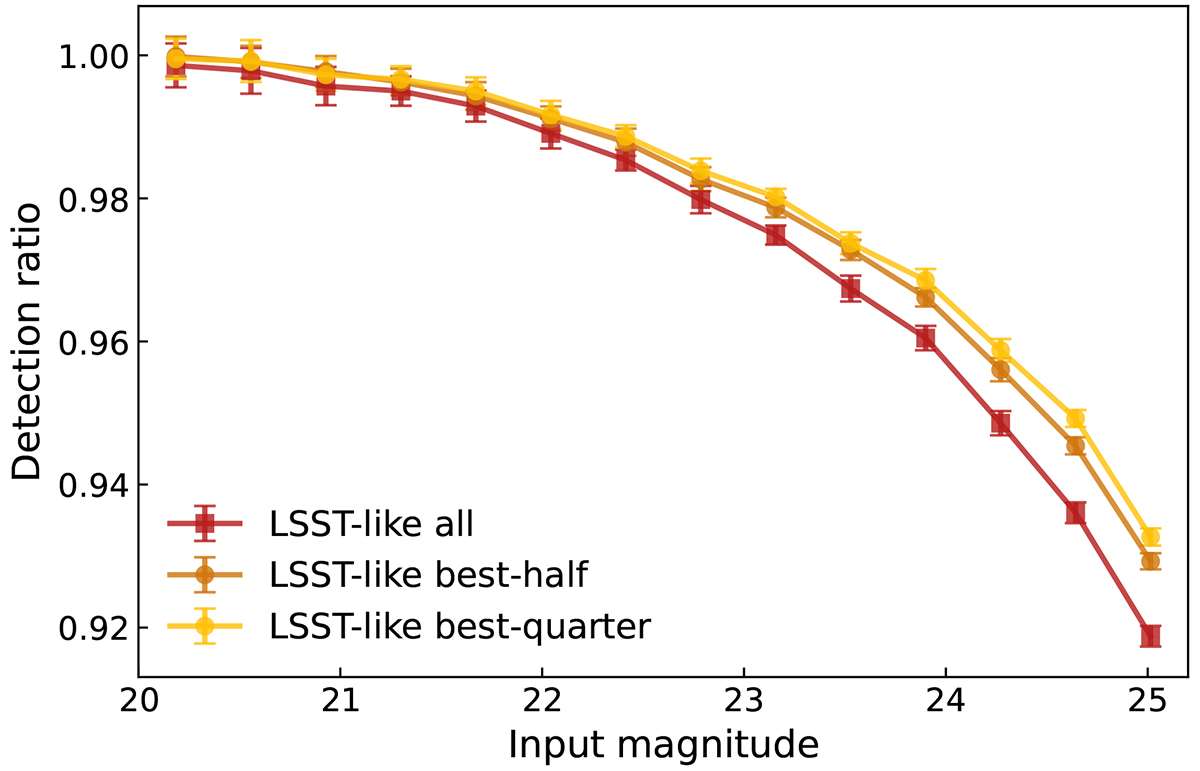
Detection efficiency relative to the LSST-like grid-based case with all stacked exposures as a function of input magnitude, shown for three subsets: all exposures (red), best-half seeing (orange), and best-quarter seeing (yellow).
Current usage metrics show cumulative count of Article Views (full-text article views including HTML views, PDF and ePub downloads, according to the available data) and Abstracts Views on Vision4Press platform.
Data correspond to usage on the plateform after 2015. The current usage metrics is available 48-96 hours after online publication and is updated daily on week days.
Initial download of the metrics may take a while.