Fig. 3.
Download original image
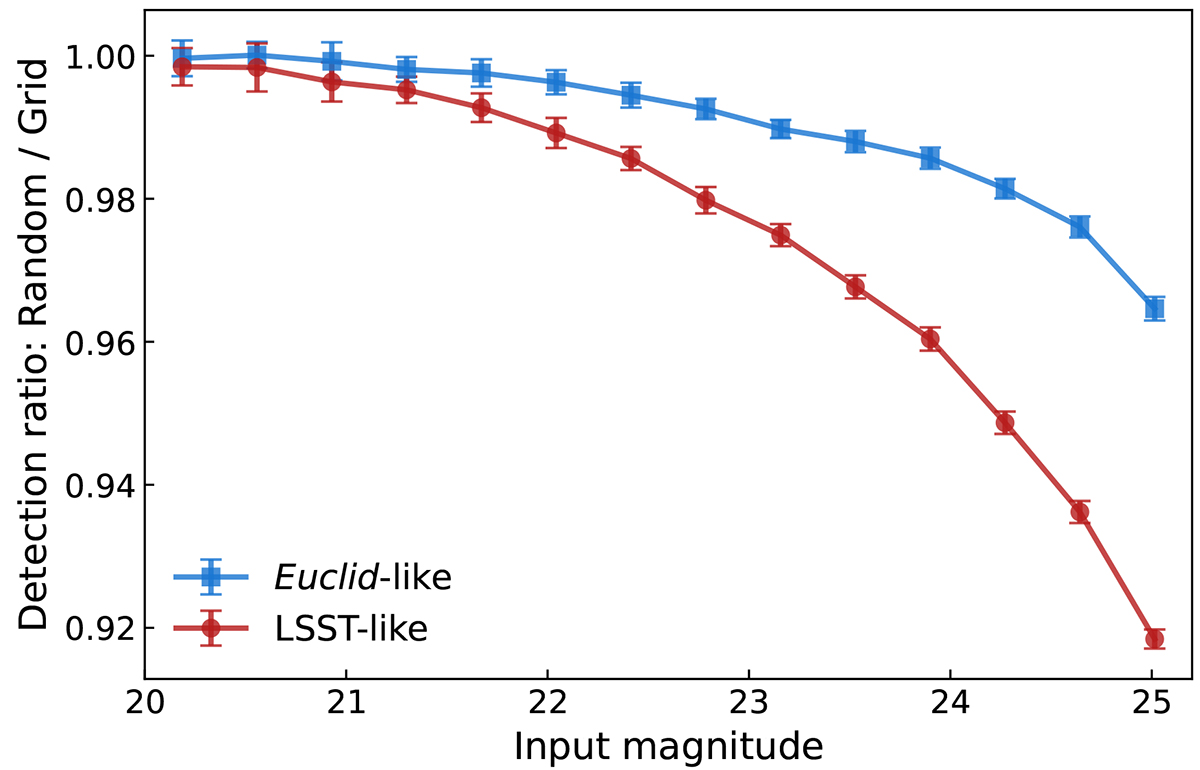
Ratio of detected number densities between random and grid cases for each survey (blue: Euclid-like; red: LSST-like). For reference, for galaxies with an input magnitude of 25, the mean S/N, computed as the average of FLUX_AUTO/FLUXERR_AUTO, is 7.13 for the Euclid-like survey and 16.20 for the LSST-like survey when galaxies are placed randomly.
Current usage metrics show cumulative count of Article Views (full-text article views including HTML views, PDF and ePub downloads, according to the available data) and Abstracts Views on Vision4Press platform.
Data correspond to usage on the plateform after 2015. The current usage metrics is available 48-96 hours after online publication and is updated daily on week days.
Initial download of the metrics may take a while.