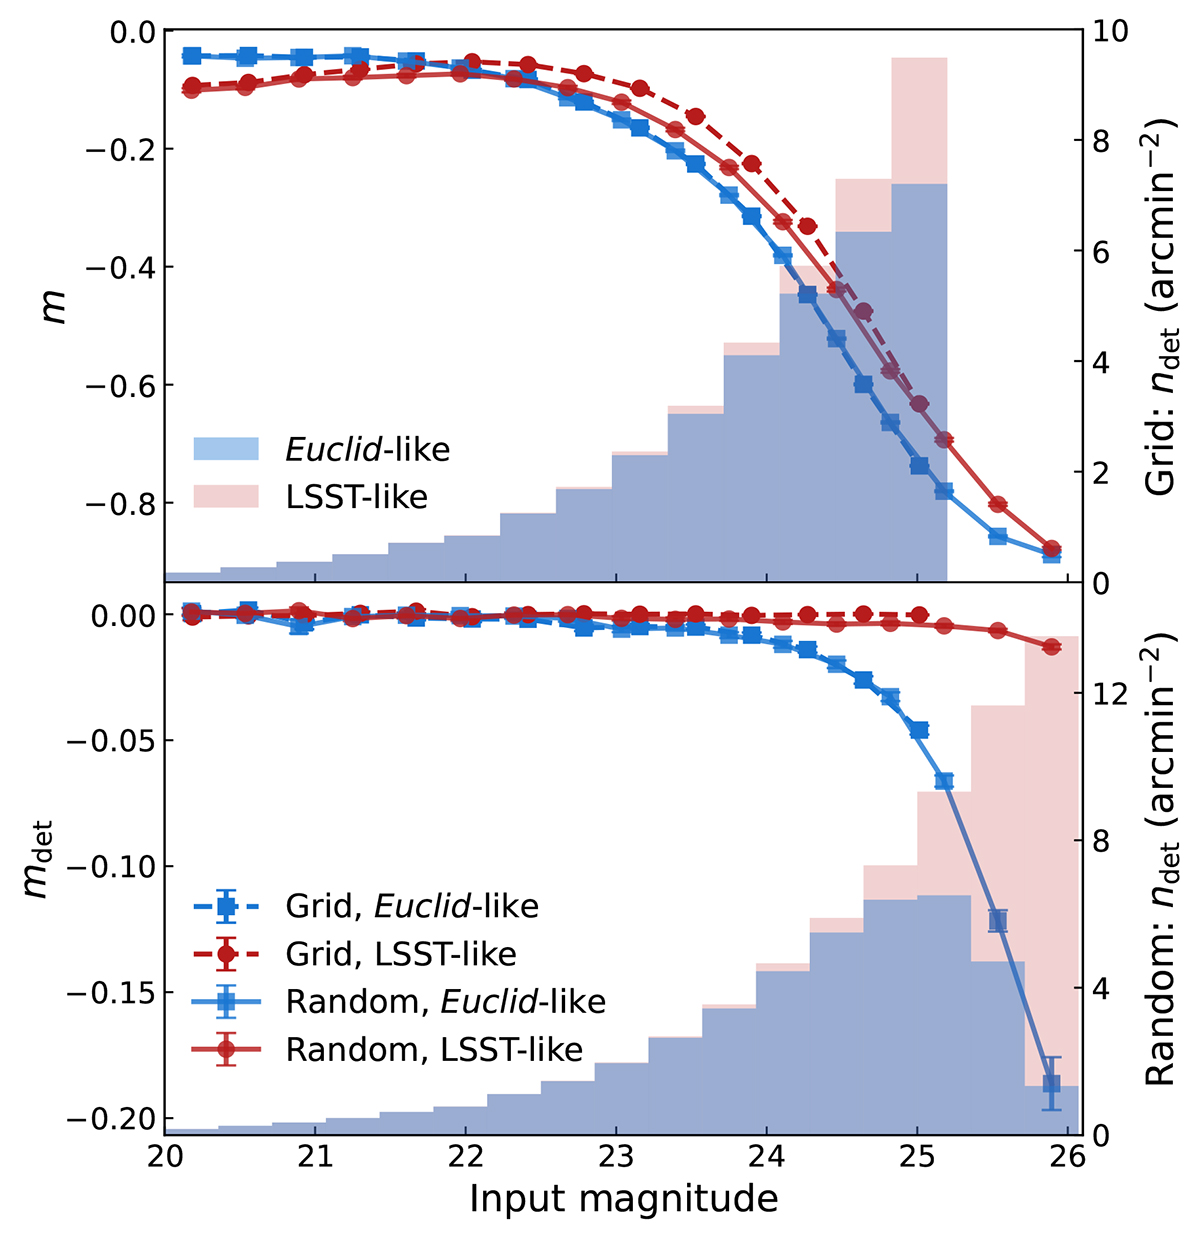
Fig. 6.
Download original image
Upper panel: Amplitude of the multiplicative bias, defined as m ≡ (m1 + m2)/2, as a function of the input r-band magnitude of galaxies. Lower panel: Multiplicative detection bias mdet as a function of the input magnitude, with galaxies placed on a grid (dashed) or randomly (solid) for both surveys, also defined as mdet ≡ (mdet, 1 + mdet, 2)/2. The magnitude ranges considered are [20.0, 25.2] for the grid case and [20.0, 27.5] for the random case. The histograms illustrate the detected number density of galaxies, with grid case shown in the upper panel and random case in the lower panel.
Current usage metrics show cumulative count of Article Views (full-text article views including HTML views, PDF and ePub downloads, according to the available data) and Abstracts Views on Vision4Press platform.
Data correspond to usage on the plateform after 2015. The current usage metrics is available 48-96 hours after online publication and is updated daily on week days.
Initial download of the metrics may take a while.