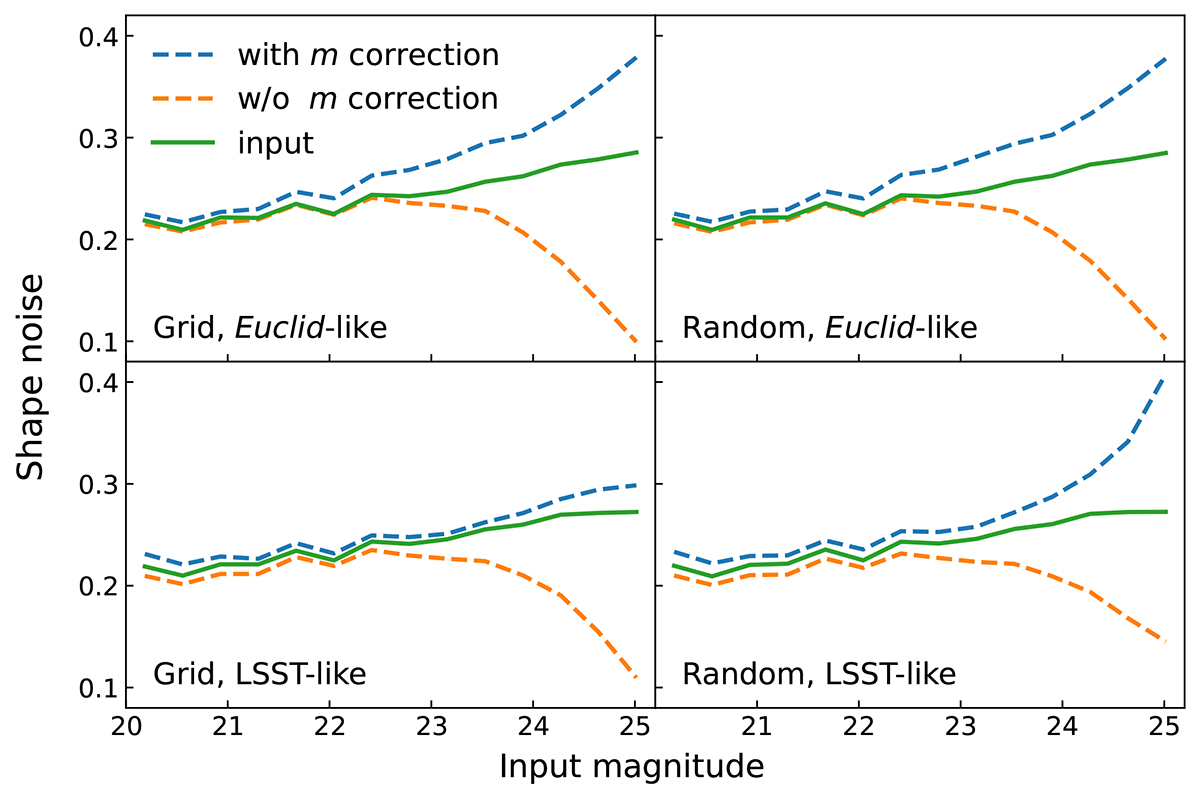
Fig. 7.
Download original image
Empirically estimated shape noise, σtot (Eq. (6)), with (dashed blue lines) and without (dashed orange lines) multiplicative bias correction, compared to the detection bias–corrected intrinsic shape noise (solid green lines), σint (Eq. (7)), as a function of input magnitude. Upper panels: Comparisons for Euclid-like setups. The difference between the grid-based and randomly placed configurations is negligible; however, in both cases, applying the bias correction slightly overestimates the shape noise likely arises from second-order effects that are not captured in the multiplicative bias correction. Lower panels: Comparisons for LSST-like setups. For randomly placed galaxies, the corrected σtot rises significantly for magnitudes ≳23.5 relative to the grid case, indicating that blending effects become increasingly important at fainter magnitudes.
Current usage metrics show cumulative count of Article Views (full-text article views including HTML views, PDF and ePub downloads, according to the available data) and Abstracts Views on Vision4Press platform.
Data correspond to usage on the plateform after 2015. The current usage metrics is available 48-96 hours after online publication and is updated daily on week days.
Initial download of the metrics may take a while.