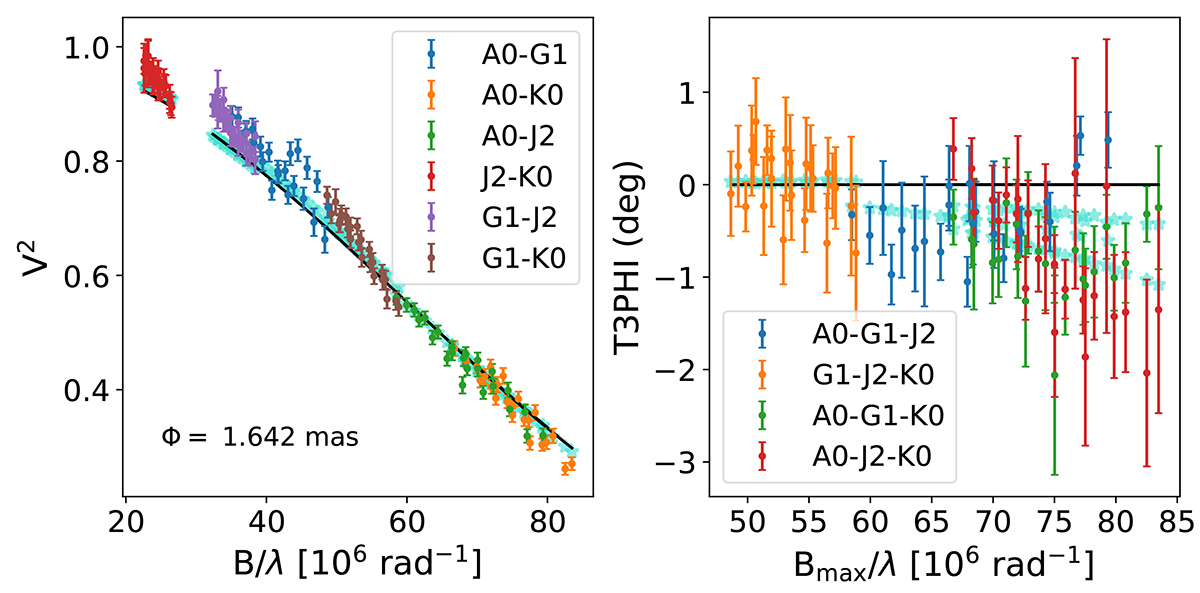
Fig. 1.
Download original image
Reduced PIONIER interferometric data for ZZ CMi. The left plot shows the squared visibilities (V2), while the right one shows the closure phases (T3PHI) in degrees. The colours correspond to the various baselines (B, expressed in terms of the wavelengths, λ), while the black line is the simple fit of a uniform diameter. The turquoise stars are the fit corresponding to a Roche-lobe filling (and, hence, deformed) star. They are mostly different from the black line in the closure phases.
Current usage metrics show cumulative count of Article Views (full-text article views including HTML views, PDF and ePub downloads, according to the available data) and Abstracts Views on Vision4Press platform.
Data correspond to usage on the plateform after 2015. The current usage metrics is available 48-96 hours after online publication and is updated daily on week days.
Initial download of the metrics may take a while.