Open Access
Fig. 2.
Download original image
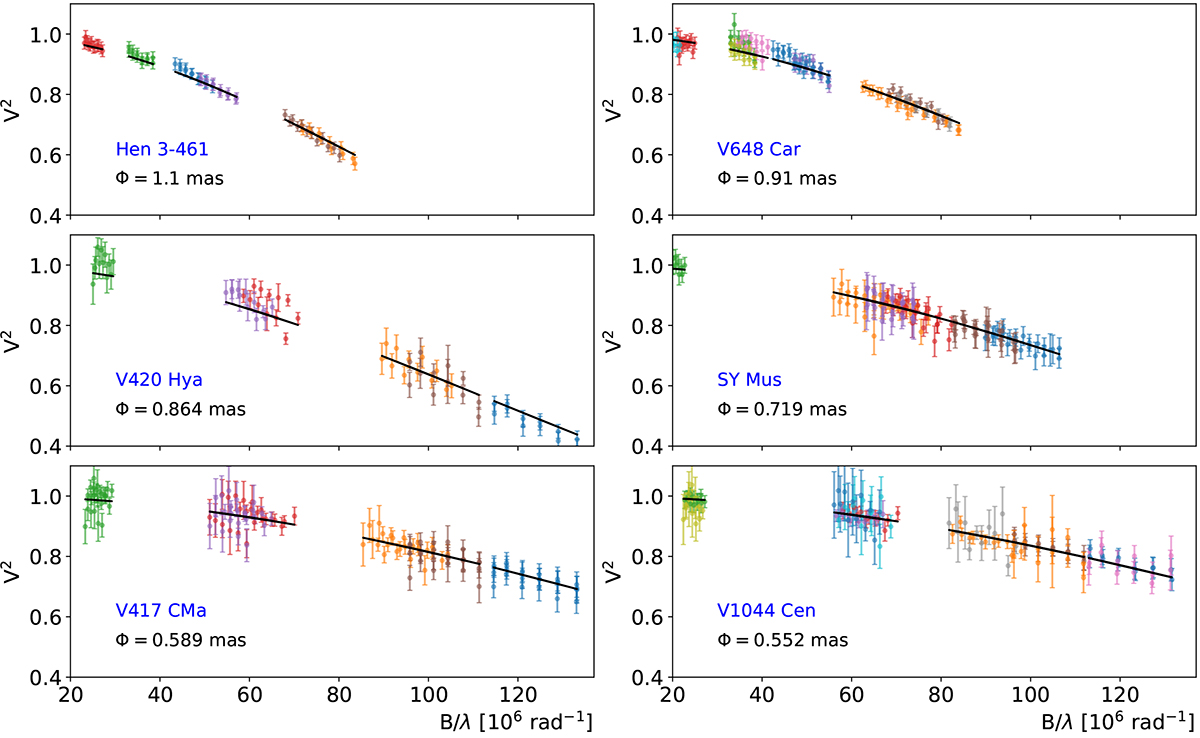
Squared visibilities for the remaining six symbiotic systems as a function of the baselines. The colours correspond to the various baselines, while the black line is the fit. The angular diameter that is then obtained is also indicated.
Current usage metrics show cumulative count of Article Views (full-text article views including HTML views, PDF and ePub downloads, according to the available data) and Abstracts Views on Vision4Press platform.
Data correspond to usage on the plateform after 2015. The current usage metrics is available 48-96 hours after online publication and is updated daily on week days.
Initial download of the metrics may take a while.