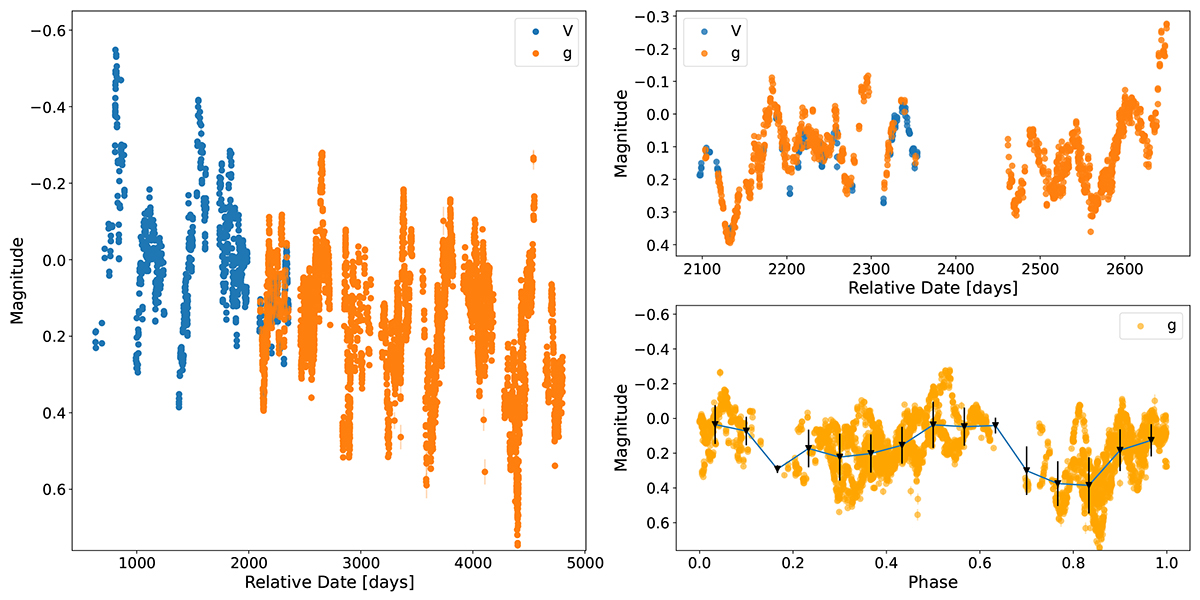
Fig. 5.
Download original image
ASAS-SN light curve of V420 Hya is shown on the left, with magnitudes in the V and g bands. The g-band observations were shifted by 0.18 mag to bring them in line with the V ones. The upper right panel shows a zoom-in region of 600 days to highlight the short-term periodicity. The lower right panel shows the g-band data folded on the best period we determined, 767.364 days, together with some phase-averaged means to illustrate the apparent ellipsoidal or eclipsing variations.
Current usage metrics show cumulative count of Article Views (full-text article views including HTML views, PDF and ePub downloads, according to the available data) and Abstracts Views on Vision4Press platform.
Data correspond to usage on the plateform after 2015. The current usage metrics is available 48-96 hours after online publication and is updated daily on week days.
Initial download of the metrics may take a while.