Fig. D.1.
Download original image
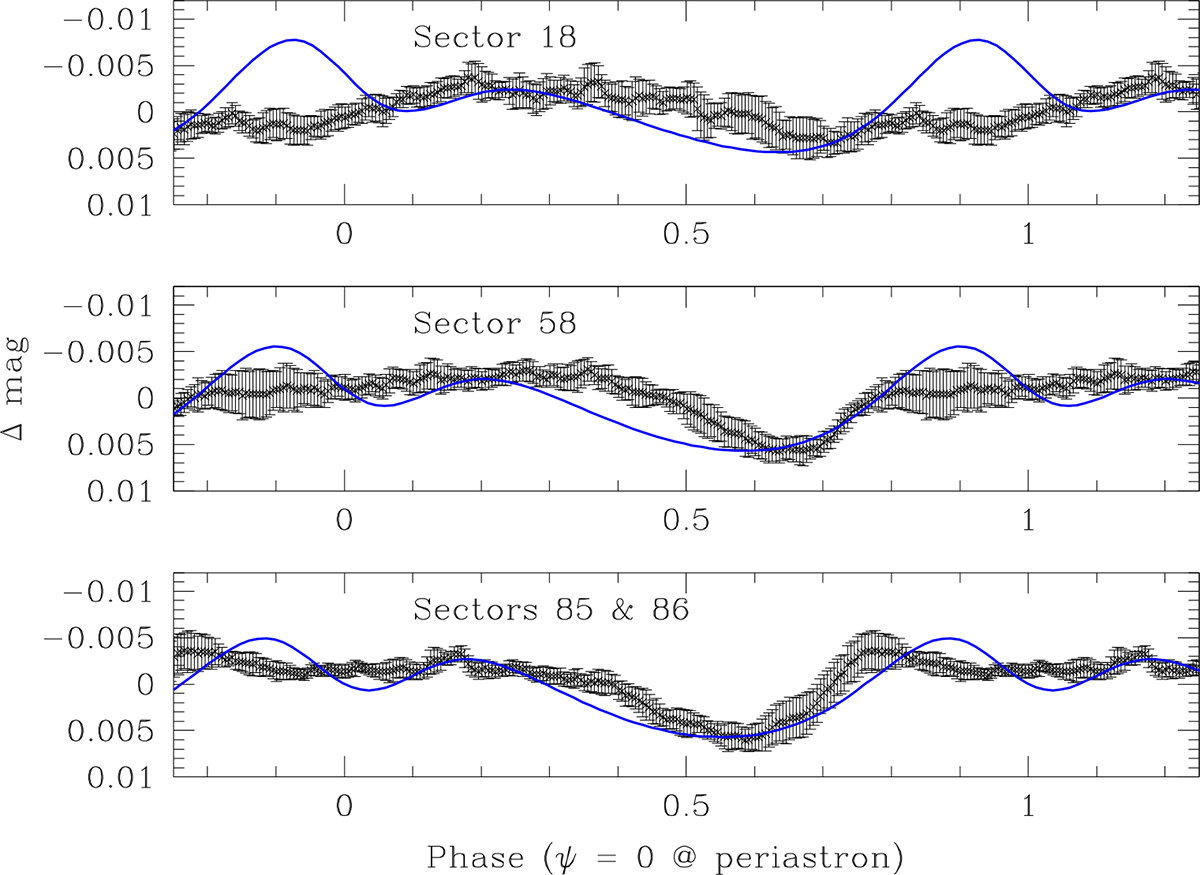
Phase-folded TESS light curves of BD+60° 497. The blue curve shows the Nightfall model that offers a reasonable agreement with the data from Sectors 85 and 86 (bottom panel). Phase 0.0 corresponds to periastron passage. The top and middle panel illustrate the same model with the ω values propagated backwards to Sectors 18 and 58 (see text).
Current usage metrics show cumulative count of Article Views (full-text article views including HTML views, PDF and ePub downloads, according to the available data) and Abstracts Views on Vision4Press platform.
Data correspond to usage on the plateform after 2015. The current usage metrics is available 48-96 hours after online publication and is updated daily on week days.
Initial download of the metrics may take a while.