Fig. 2.
Download original image
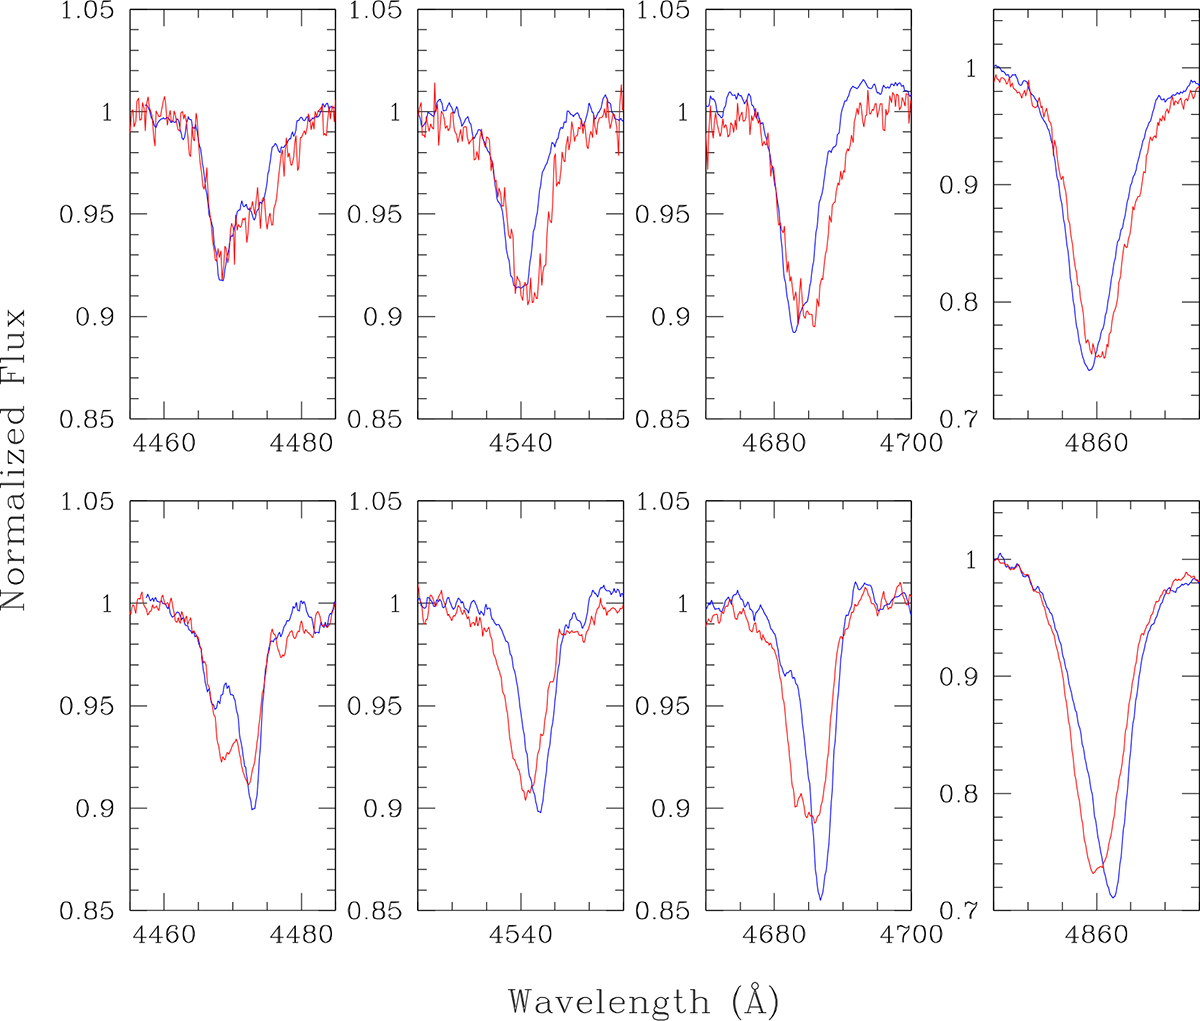
Comparison between the strongest lines in the Aurélie spectra as observed in 2002−2003 (blue) and 2018−2022 (red). The lines are, from left to right He Iλ 4471, He IIλ 4542, He IIλ 4686, and Hβ. The top panel illustrates the spectra observed close to the quadrature with the primary moving towards the observer, whilst the bottom panel illustrates the comparison for phases near the opposite quadrature. Spectra in the top panel were taken on HJD 2452928.641 (blue) and HJD 2459853.5509 (red), that is respectively at phases 0.99 (ω = 150°, position angle 236°) and 0.78 (ω = 261°, position angle 254°) according to our ‘RV dataset 2’ ephemerides in the forthcoming Table 1. Spectra in the bottom panel were obtained on HJD 2452527.555 (blue) and HJD 2458719.6140 (red), that is respectively phases 0.70 (ω = 144°, position angle 111°) and 0.42 (ω = 243°, position angle 130°) according to the same ephemerides.
Current usage metrics show cumulative count of Article Views (full-text article views including HTML views, PDF and ePub downloads, according to the available data) and Abstracts Views on Vision4Press platform.
Data correspond to usage on the plateform after 2015. The current usage metrics is available 48-96 hours after online publication and is updated daily on week days.
Initial download of the metrics may take a while.