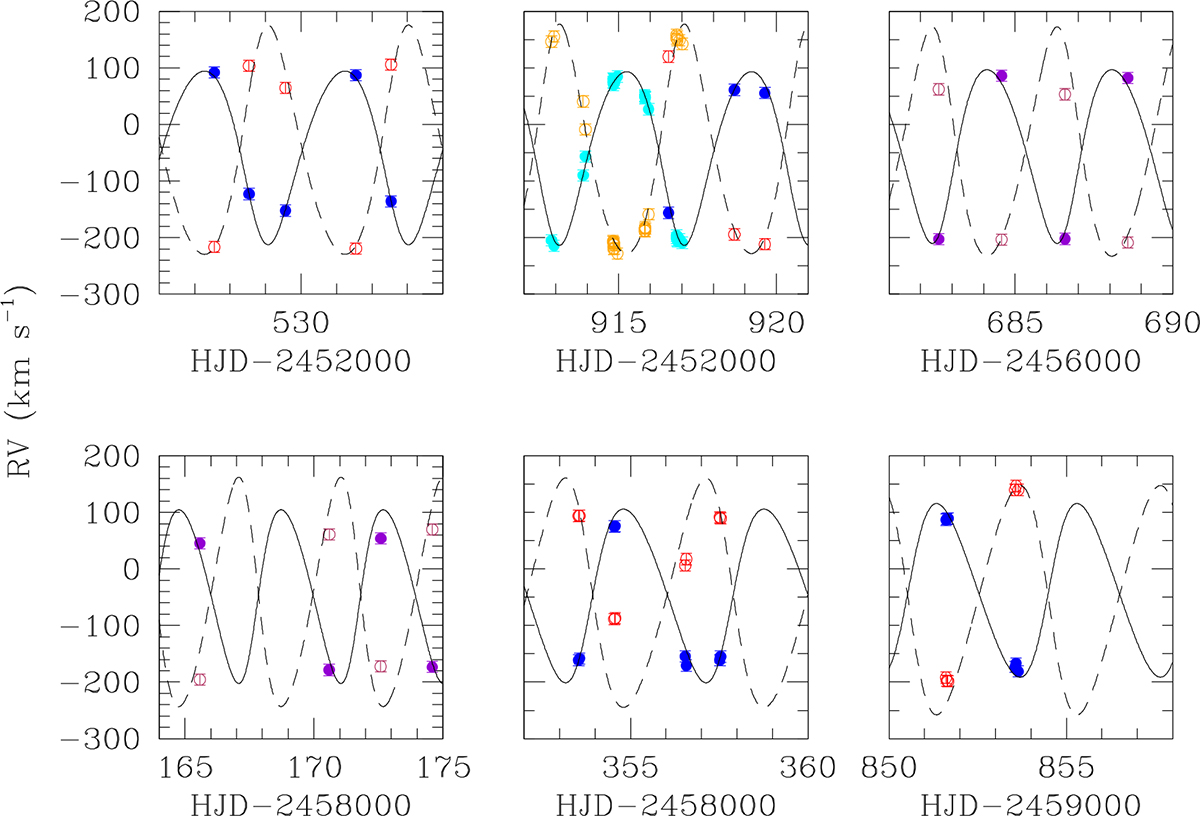
Fig. 3.
Download original image
Comparison between the best-fit model for the primary RVs (black solid curve) computed with relation 1 for dataset 2. Cyan, blue, and violet filled symbols stand respectively for primary RVs from Hillwig et al. (2006) and our disentangling of the Aurélie and HEROS spectra. The orange, red, and maroon open symbols show the secondary RVs (not used in the fit) respectively from Hillwig et al. (2006), our Aurélie and HEROS data, whilst the dashed line illustrates the secondary RV solution inferred from the primary RV curve for a mass ratio q = mp/ms = 1.28 ± 0.03.
Current usage metrics show cumulative count of Article Views (full-text article views including HTML views, PDF and ePub downloads, according to the available data) and Abstracts Views on Vision4Press platform.
Data correspond to usage on the plateform after 2015. The current usage metrics is available 48-96 hours after online publication and is updated daily on week days.
Initial download of the metrics may take a while.