Fig. 4.
Download original image
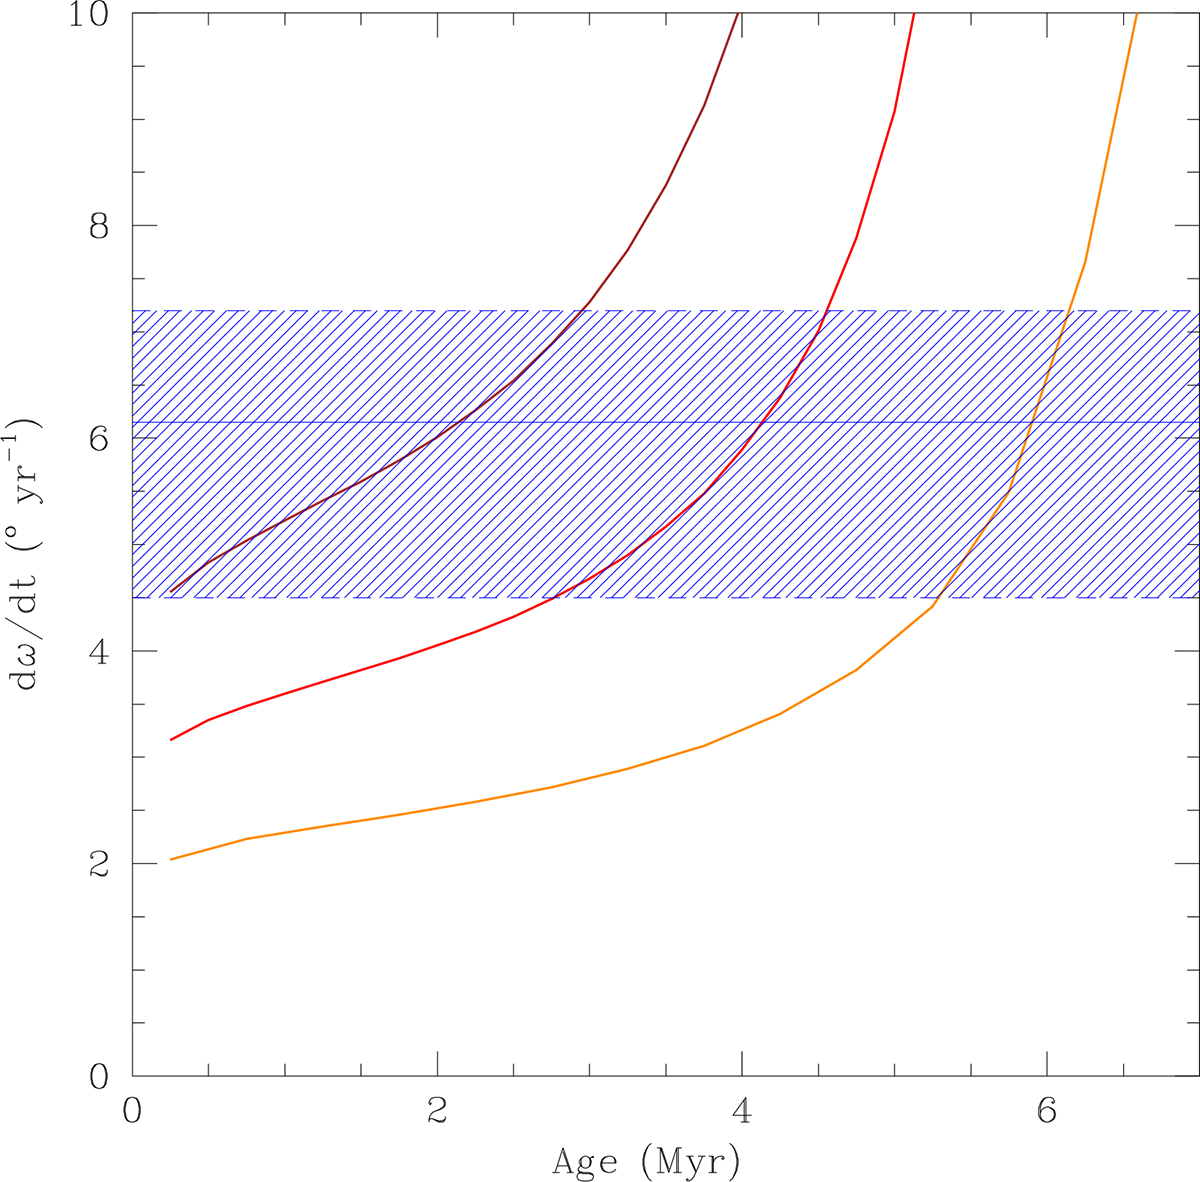
Evolution of the total ![]() (Newtonian plus general relativity) as a function of age. The red curve displays this evolution for solar-metallicity stars of 26.2 M⊙ and 20.4 M⊙ in a binary with e = 0.15 and Panom = 3.95984 d according to the models of Claret (2019). The solid blue line shows our best estimate of
(Newtonian plus general relativity) as a function of age. The red curve displays this evolution for solar-metallicity stars of 26.2 M⊙ and 20.4 M⊙ in a binary with e = 0.15 and Panom = 3.95984 d according to the models of Claret (2019). The solid blue line shows our best estimate of ![]() for BD+60° 497, and the hatched area provides the associated uncertainty. The brown and orange curves correspond to systems respectively with stars of masses 30.3 M⊙ + 23.7 M⊙ and 21.9 M⊙ + 17.1 M⊙.
for BD+60° 497, and the hatched area provides the associated uncertainty. The brown and orange curves correspond to systems respectively with stars of masses 30.3 M⊙ + 23.7 M⊙ and 21.9 M⊙ + 17.1 M⊙.
Current usage metrics show cumulative count of Article Views (full-text article views including HTML views, PDF and ePub downloads, according to the available data) and Abstracts Views on Vision4Press platform.
Data correspond to usage on the plateform after 2015. The current usage metrics is available 48-96 hours after online publication and is updated daily on week days.
Initial download of the metrics may take a while.