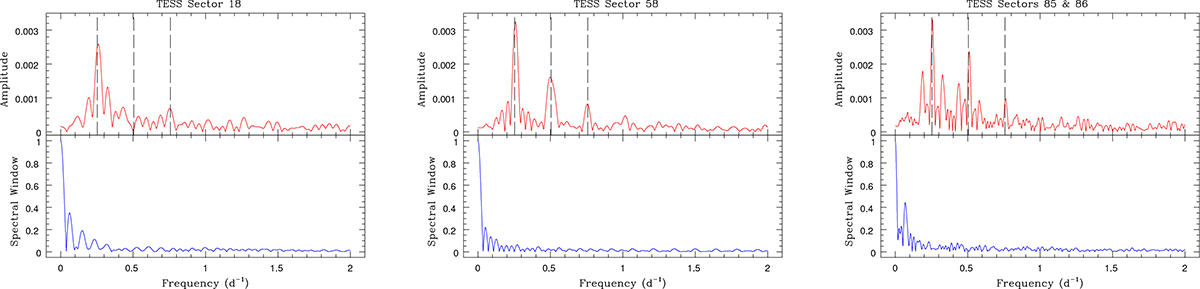
Fig. 9.
Download original image
Fourier amplitude spectra of the TESS light curves of BD+60° 497. For each sector or combination of sectors, the upper panel shows the Fourier spectrum of the photometric time series, whereas the lower panel displays the spectral window function associated with the sampling. The dashed vertical lines indicate the orbital frequency corresponding to Panom and its n = 2 and n = 3 harmonics.
Current usage metrics show cumulative count of Article Views (full-text article views including HTML views, PDF and ePub downloads, according to the available data) and Abstracts Views on Vision4Press platform.
Data correspond to usage on the plateform after 2015. The current usage metrics is available 48-96 hours after online publication and is updated daily on week days.
Initial download of the metrics may take a while.