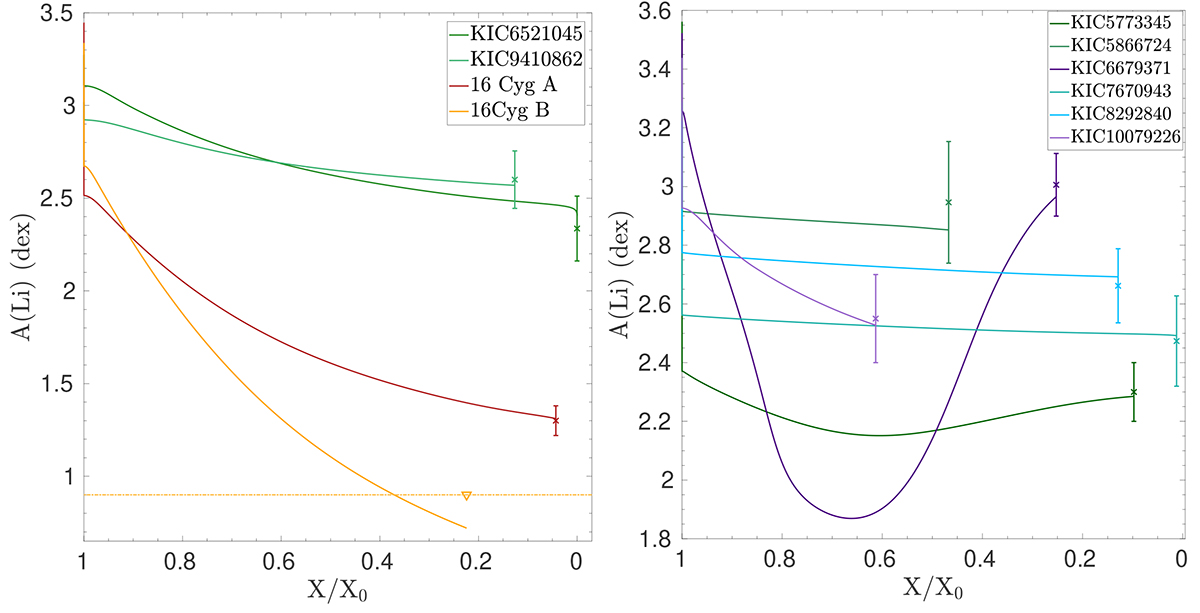
Fig. 2.
Download original image
Left panel: Evolution of the surface lithium abundance (A(Li)) as a function of central hydrogen abundance (normalised by the initial value) for the lower-mass stars in our sample (G-type stars). The horizontal orange bar indicates the higher limit value for 16Cyg B. Right panel: Same as the left panel, but for the higher-mass stars in our sample (F-type stars) for which undershooting at the base of the convective envelope is necessary to reproduce the surface lithium abundance.
Current usage metrics show cumulative count of Article Views (full-text article views including HTML views, PDF and ePub downloads, according to the available data) and Abstracts Views on Vision4Press platform.
Data correspond to usage on the plateform after 2015. The current usage metrics is available 48-96 hours after online publication and is updated daily on week days.
Initial download of the metrics may take a while.