Fig. 7.
Download original image
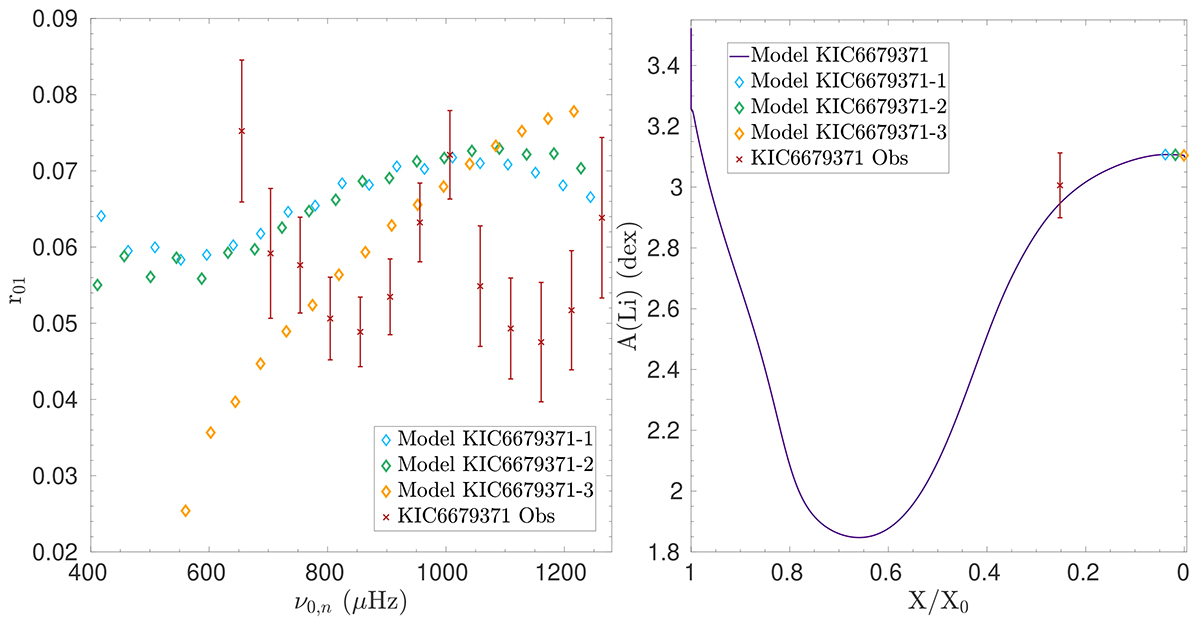
Left panel: Frequency separation ratios (r01) of KIC6679371 as a function of observed frequency. Right panel: Surface lithium abundance as a function of normalised central hydrogen abundance. The observed value, associated with the X/X0 from the optimal model, is shown in red. The green, orange, and blue diamonds indicate the positions of Models 1, 2, and 3. Three evolutionary models at the end of the main sequence (denoted Models 1, 2, and 3) are shown.
Current usage metrics show cumulative count of Article Views (full-text article views including HTML views, PDF and ePub downloads, according to the available data) and Abstracts Views on Vision4Press platform.
Data correspond to usage on the plateform after 2015. The current usage metrics is available 48-96 hours after online publication and is updated daily on week days.
Initial download of the metrics may take a while.