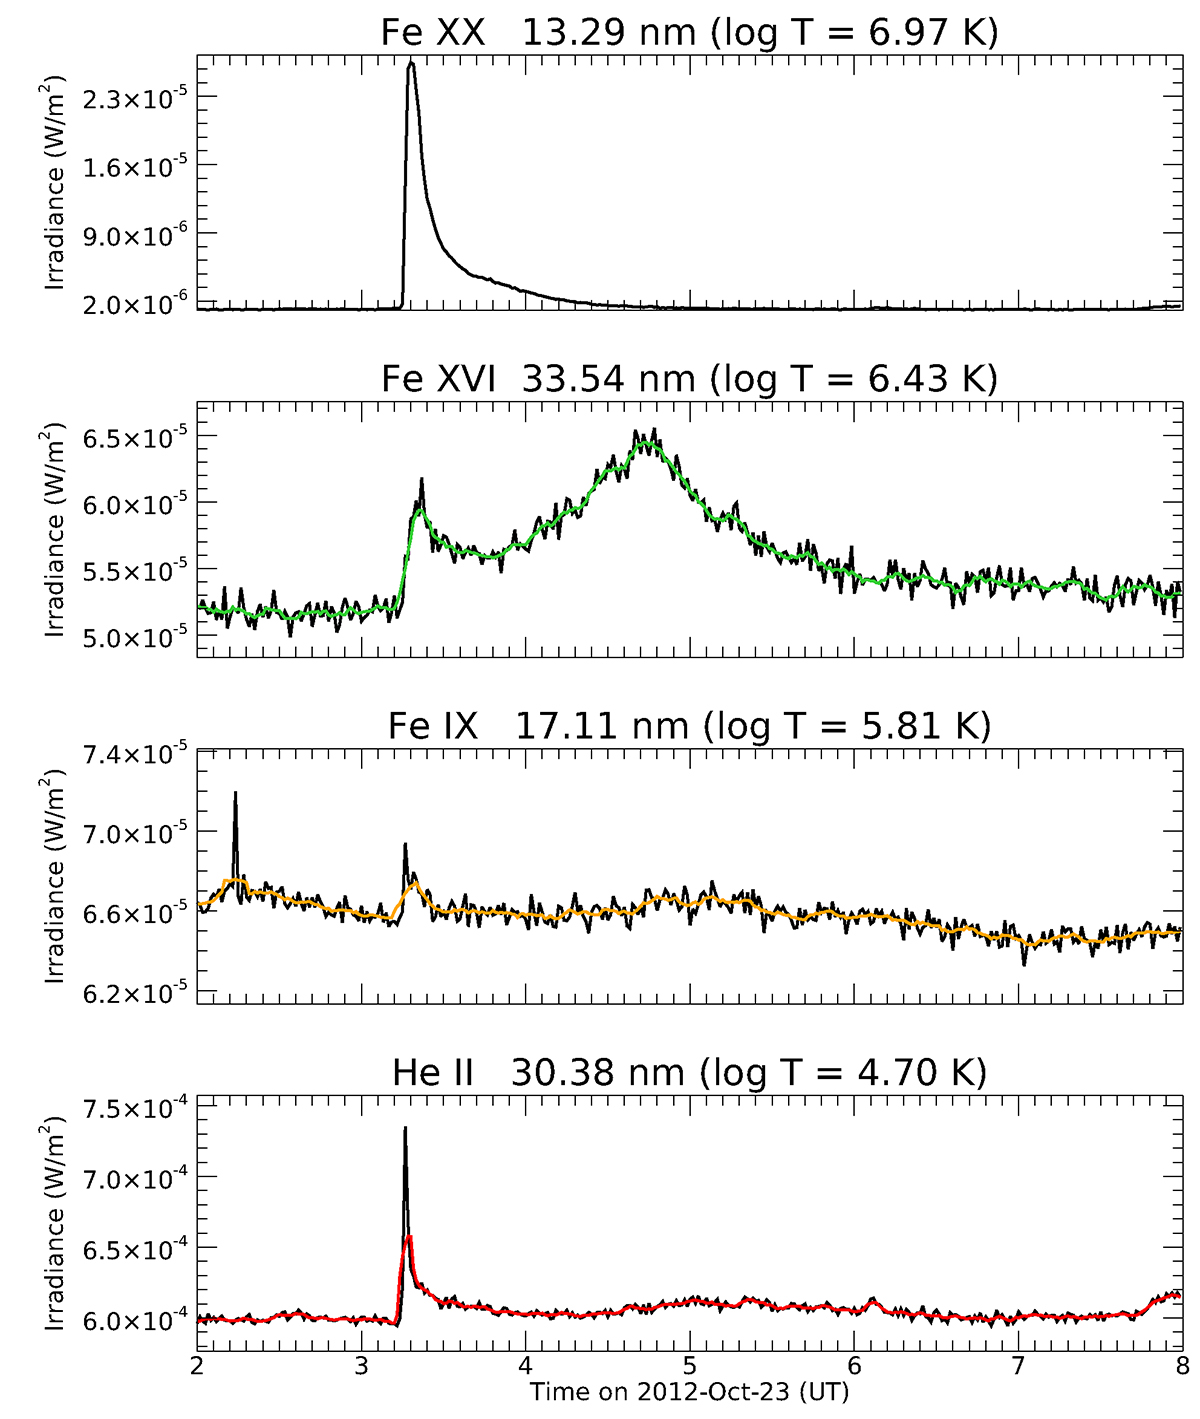
Fig. 1.
Download original image
Unsmoothed (black) and smoothed (green, yellow, and red) light curves of the EVE emission lines from Table A.1 for the X1.8 flare on October 23, 2012. The light curves are arranged according to the corresponding line formation temperature (given above each panel), decreasing from top to bottom. The Fe XX light curves were not smoothed.
Current usage metrics show cumulative count of Article Views (full-text article views including HTML views, PDF and ePub downloads, according to the available data) and Abstracts Views on Vision4Press platform.
Data correspond to usage on the plateform after 2015. The current usage metrics is available 48-96 hours after online publication and is updated daily on week days.
Initial download of the metrics may take a while.