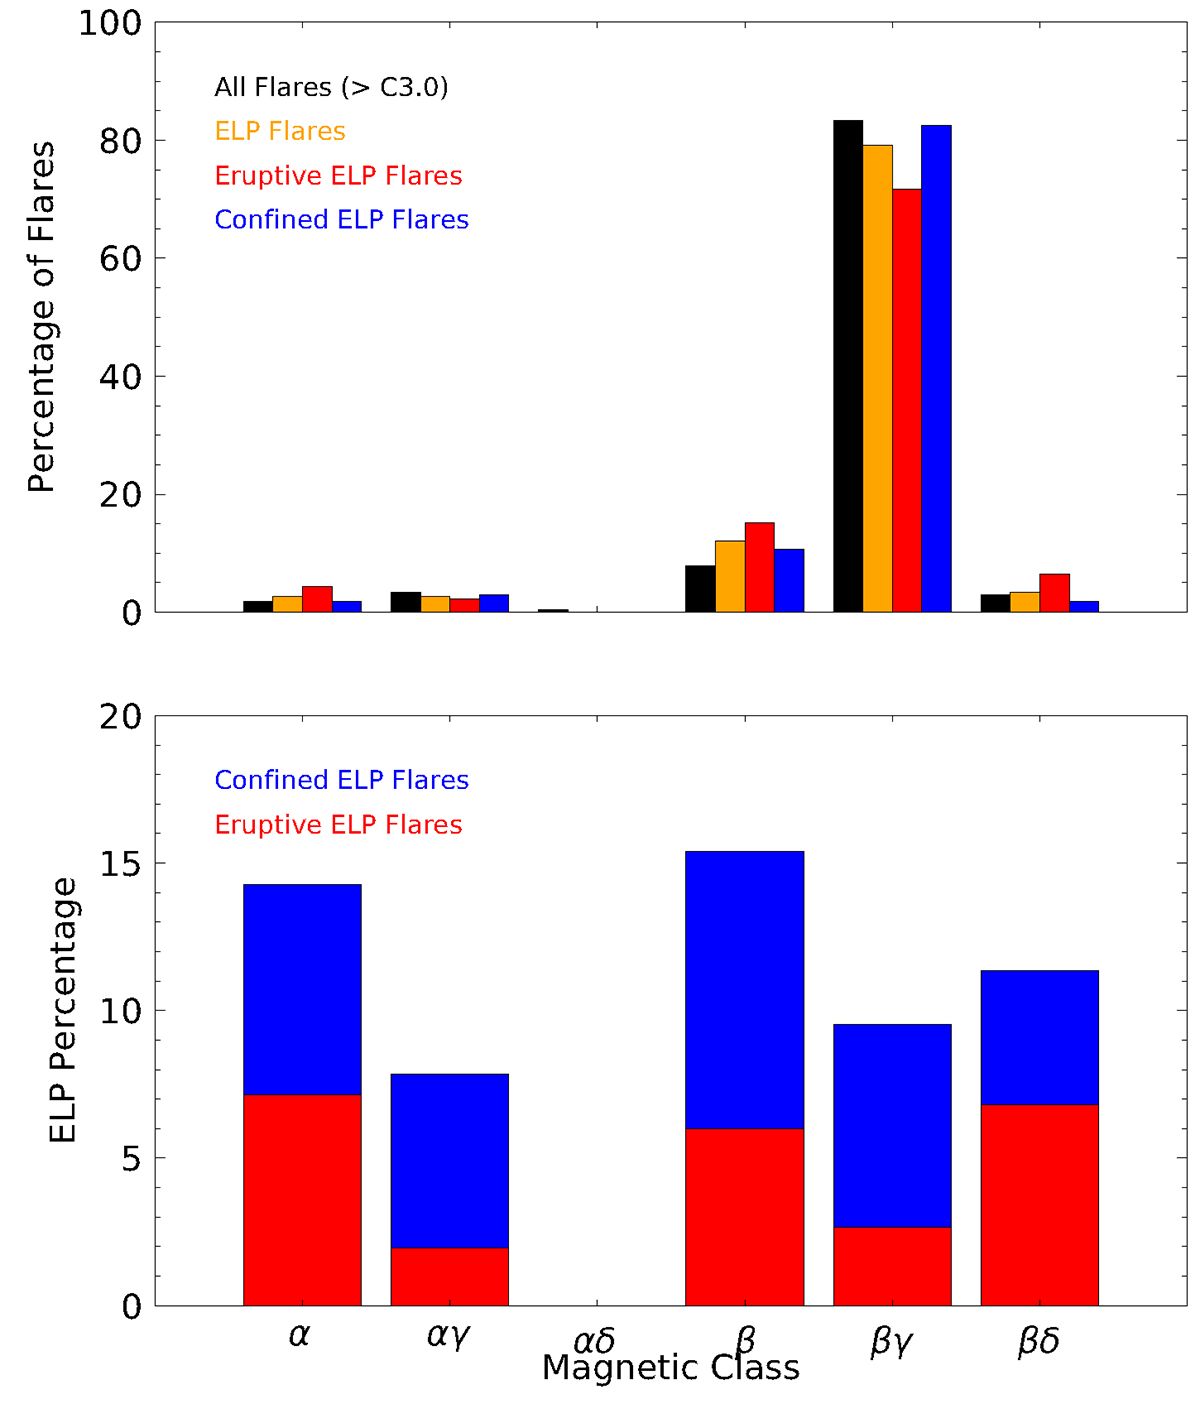
Fig. 13.
Download original image
Relative number of flares (top) as well as percentage of flares identified as ELPs (bottom) as a function of the Mount Wilson magnetic classification of the flare-harboring sunspot region for all flares with a GOES class exceeding C3.0 (black), all ELP flares (orange), as well as the eruptive (red) and confined (blue) portion of ELP flares. The y-axis in the top panel displays the share of flares belonging to the respective group divided by the total number of flares in this colored category (in %).
Current usage metrics show cumulative count of Article Views (full-text article views including HTML views, PDF and ePub downloads, according to the available data) and Abstracts Views on Vision4Press platform.
Data correspond to usage on the plateform after 2015. The current usage metrics is available 48-96 hours after online publication and is updated daily on week days.
Initial download of the metrics may take a while.