Fig. C.1.
Download original image
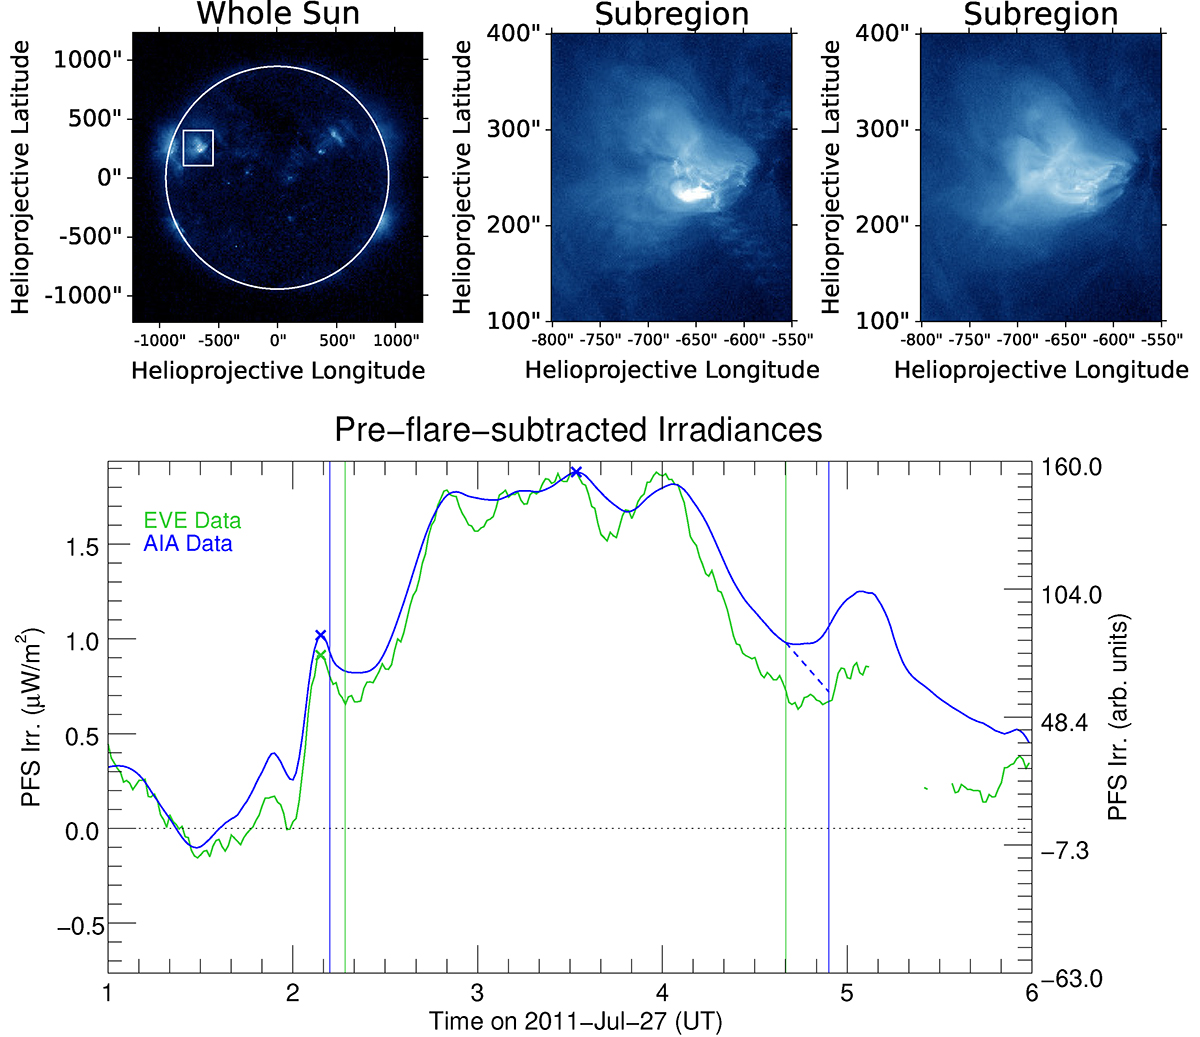
AIA 33.5 nm images as well as EVE and AIA light curves of a selected subregion for the C3.0 flare on July 27, 2011. The top row depicts AIA 33.5 nm images for the whole Sun (left) and the subregion (middle and right). The white box in the left image indicates the subregion, while the white circle marks the solar limb. The subregion images were taken at 02:09 UT and 03:32 UT, i.e., during the main- and late-phase peak, respectively. The bottom panel shows the EVE 33.5 nm PFS irradiance curve (green) together with the AIA 33.5 nm PFS subregion light curve (blue). The colored crosses mark the main- and late-phase peak of the respective light curve (in this case, both late-phase peaks coincide in time, so the green cross is not visible), while the colored vertical lines indicate the start and end of the ELP, as discussed in Sect. 3.2.7. The dashed blue line represents an estimate of the decrease in the emission level if no new flare was happening. The horizontal black dotted line marks the zero level.
Current usage metrics show cumulative count of Article Views (full-text article views including HTML views, PDF and ePub downloads, according to the available data) and Abstracts Views on Vision4Press platform.
Data correspond to usage on the plateform after 2015. The current usage metrics is available 48-96 hours after online publication and is updated daily on week days.
Initial download of the metrics may take a while.