Fig. 2.
Download original image
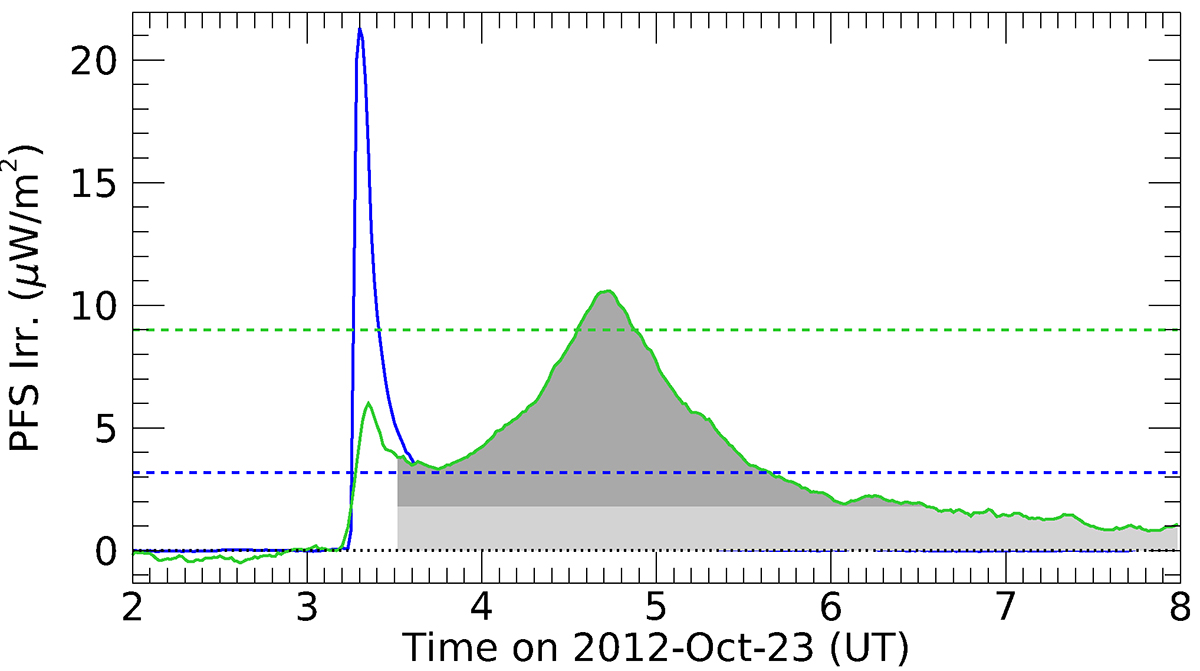
Visual representation of the ELP criteria applied in this study. Depicted are the PFS irradiances of the EVE Fe XX 13.29 nm (blue) and Fe XVI 33.54 nm (green) emission lines for the X1.8 flare on October 23, 2012. The horizontal dotted line represents the pre-flare level. The shaded gray areas correspond to the region in the Fe XVI light curve that satisfies criterion 1 (darker shade of gray) and criterion 2 (lighter and darker shade of gray together) given in Sect. 3.1. The horizontal dashed green line marks the limit corresponding to criterion 3, whereas the horizontal dashed blue line depicts the limit for criterion 4.
Current usage metrics show cumulative count of Article Views (full-text article views including HTML views, PDF and ePub downloads, according to the available data) and Abstracts Views on Vision4Press platform.
Data correspond to usage on the plateform after 2015. The current usage metrics is available 48-96 hours after online publication and is updated daily on week days.
Initial download of the metrics may take a while.