Fig. 4.
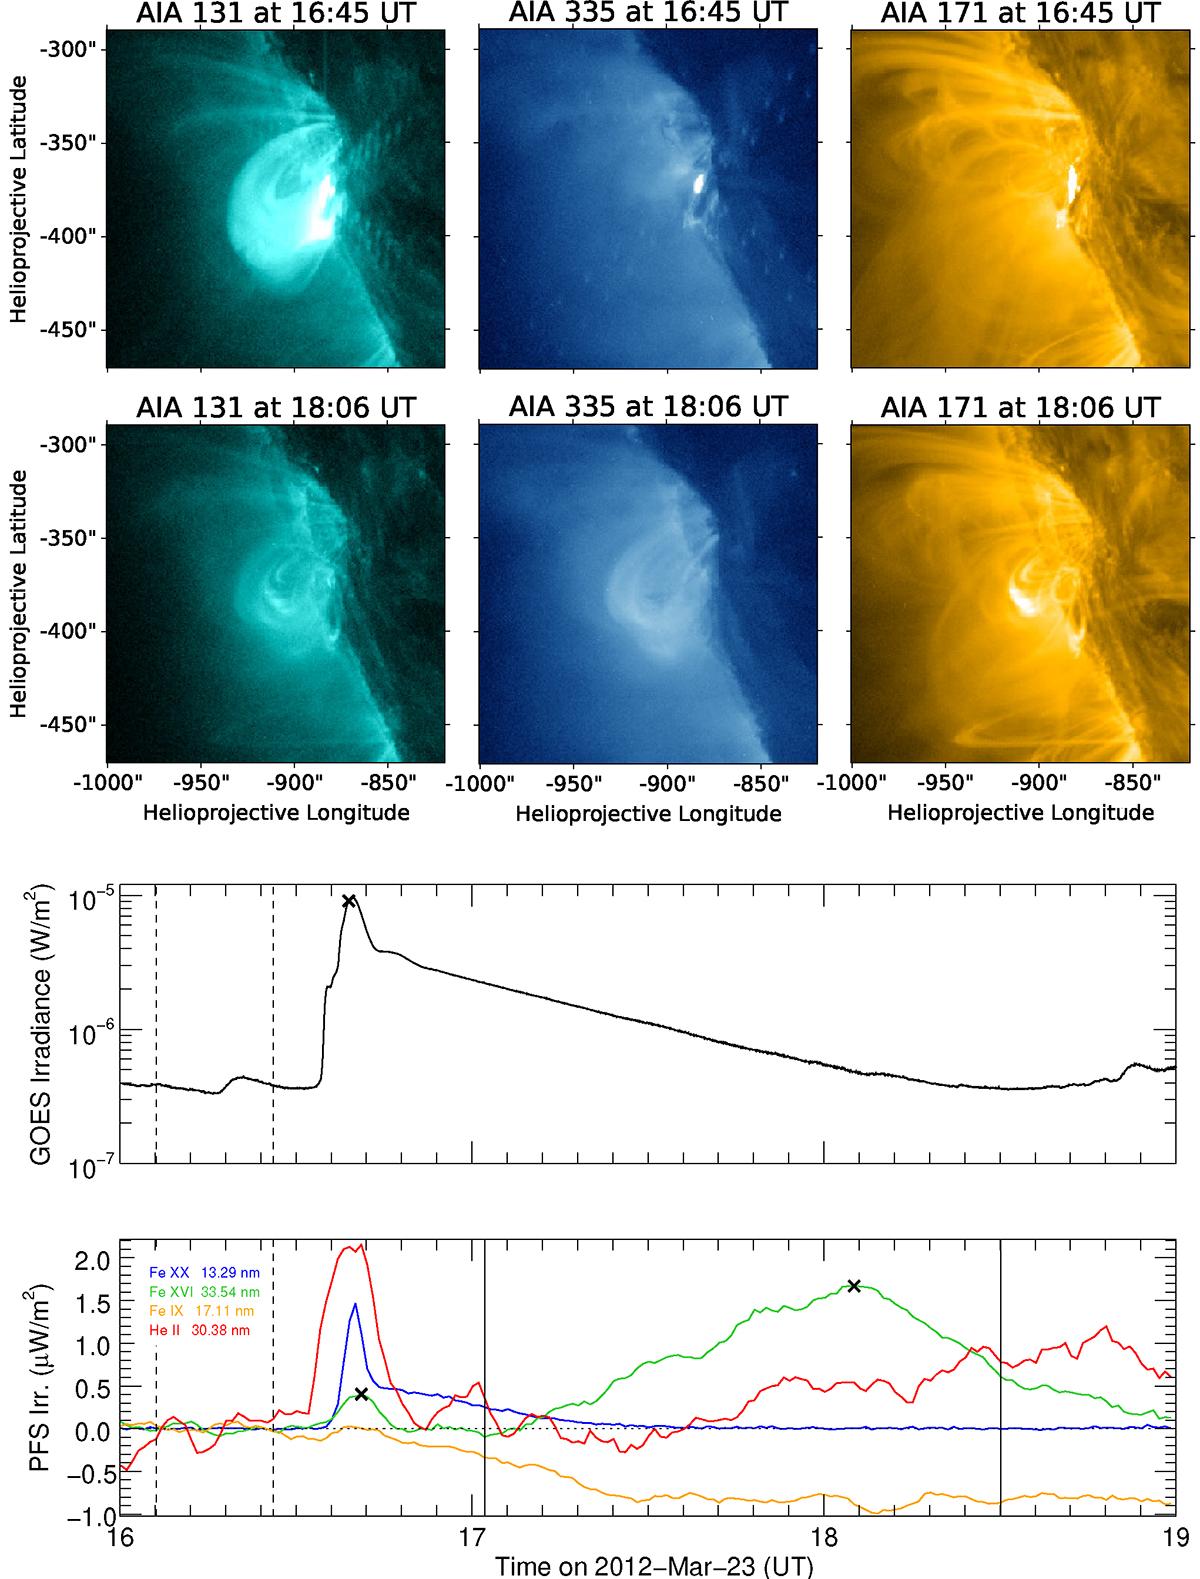
Download original image
AIA images as well as GOES and EVE light curves for the confined C6.5 flare on March 23, 2012. Top two rows: Still images taken by AIA in the 13.1 nm (left column), 33.5 nm (middle column), and 17.1 nm (right column) filter. Middle panel: GOES 0.1–0.8 nm irradiance. The start and end of the pre-flare window used to calculate the PFS irradiances are shown by the two vertical dashed lines. Bottom panel: PFS irradiances of selected EVE emission lines: Fe XX 13.29 nm (blue), Fe XVI 33.54 nm (green), Fe IX 17.11 nm (yellow), and He II 30.4 nm (red). The PFS irradiance values for the He II 30.4 nm line were divided by a factor of 3. The horizontal dotted line represents the zero level. The main-flare maximum and late-phase maximum are marked with a black cross. The vertical solid lines mark the beginning and end of the EUV late phase.
Current usage metrics show cumulative count of Article Views (full-text article views including HTML views, PDF and ePub downloads, according to the available data) and Abstracts Views on Vision4Press platform.
Data correspond to usage on the plateform after 2015. The current usage metrics is available 48-96 hours after online publication and is updated daily on week days.
Initial download of the metrics may take a while.