Open Access
Fig. 6.
Download original image
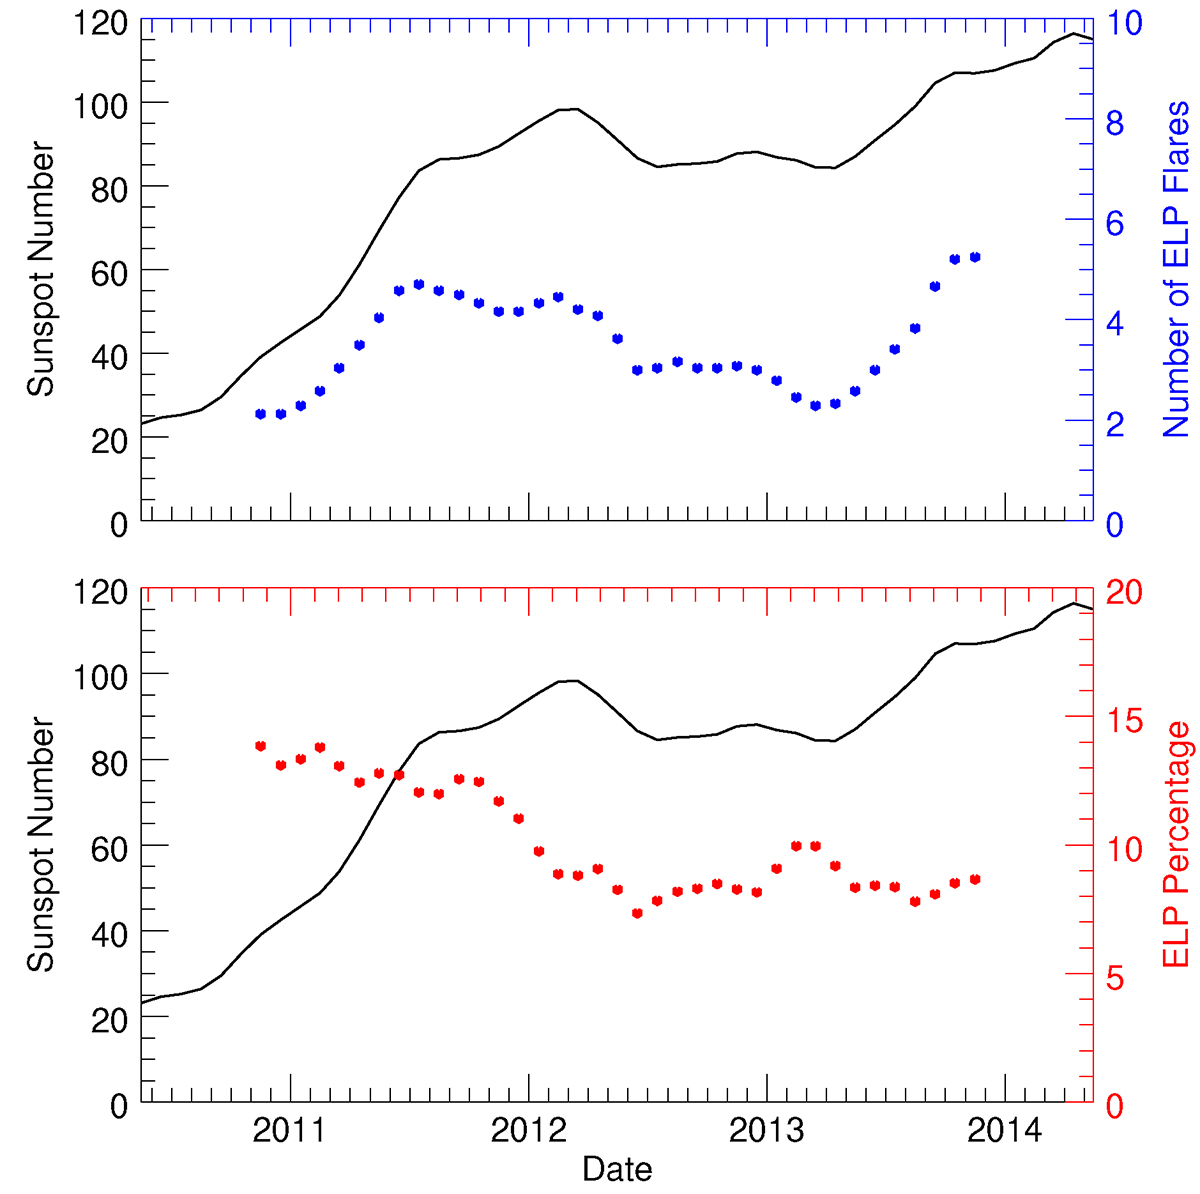
13-month smoothed monthly total number (top) and percentage (bottom) of ELP flares relative to the overall number of flares ≥C3.0 compared to the 13-month smoothed monthly mean total sunspot number (black curve) as a function of time between May 2010 and May 2014.
Current usage metrics show cumulative count of Article Views (full-text article views including HTML views, PDF and ePub downloads, according to the available data) and Abstracts Views on Vision4Press platform.
Data correspond to usage on the plateform after 2015. The current usage metrics is available 48-96 hours after online publication and is updated daily on week days.
Initial download of the metrics may take a while.