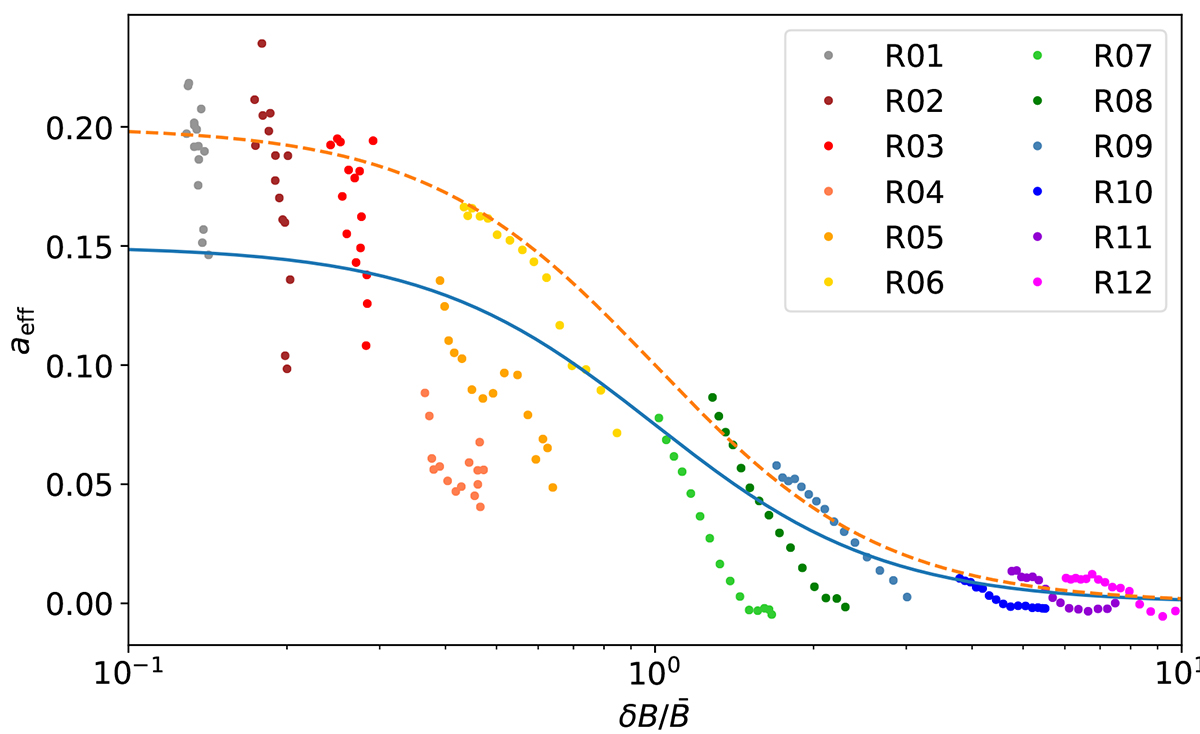
Fig. A.1.
Download original image
Comparison of the level of anisotropy in our simulations computed as in Eq. (A.1), with the analytical function in Eq. (A.5). We use a solid blue line for the value of maximum anisotropy a0 = 0.15 (our best fit value), and a dashed orange line for a0 = 0.20 (providing a sort of safety upper bound for all simulation outputs).
Current usage metrics show cumulative count of Article Views (full-text article views including HTML views, PDF and ePub downloads, according to the available data) and Abstracts Views on Vision4Press platform.
Data correspond to usage on the plateform after 2015. The current usage metrics is available 48-96 hours after online publication and is updated daily on week days.
Initial download of the metrics may take a while.