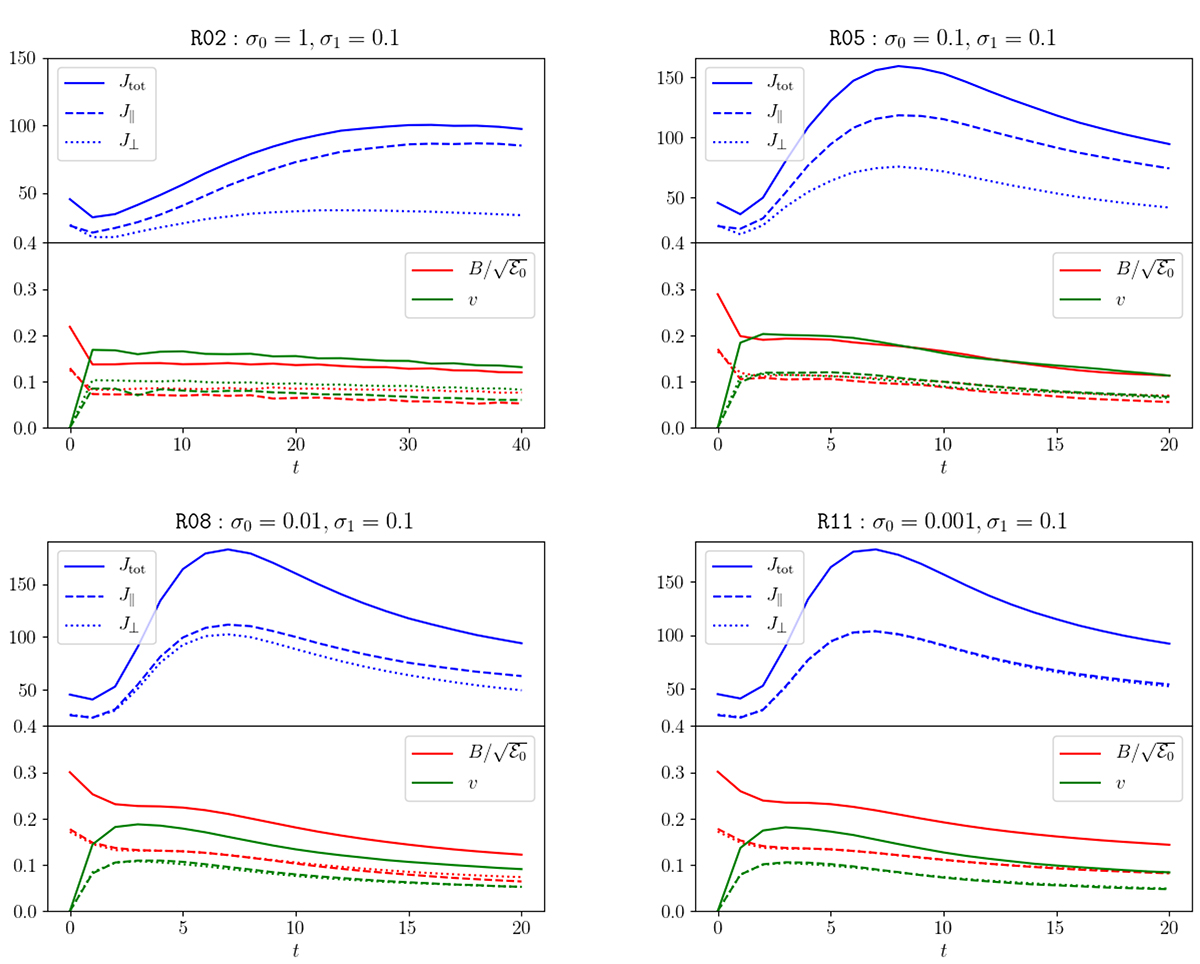
Fig. 2.
Download original image
Time sequences of rms quantities for a selection of four runs, choosing a varying σ0 while keeping σ1 = 0.1 fixed. In the upper panels we show the total current density, J = |∇×B|, J∥ (along B0), and J⊥, whereas in the bottom ones we plot ![]() , basically the Alfvén speed, and v, again total, parallel, and perpendicular components, adopting the same notations.
, basically the Alfvén speed, and v, again total, parallel, and perpendicular components, adopting the same notations.
Current usage metrics show cumulative count of Article Views (full-text article views including HTML views, PDF and ePub downloads, according to the available data) and Abstracts Views on Vision4Press platform.
Data correspond to usage on the plateform after 2015. The current usage metrics is available 48-96 hours after online publication and is updated daily on week days.
Initial download of the metrics may take a while.