Open Access
Fig. 5.
Download original image
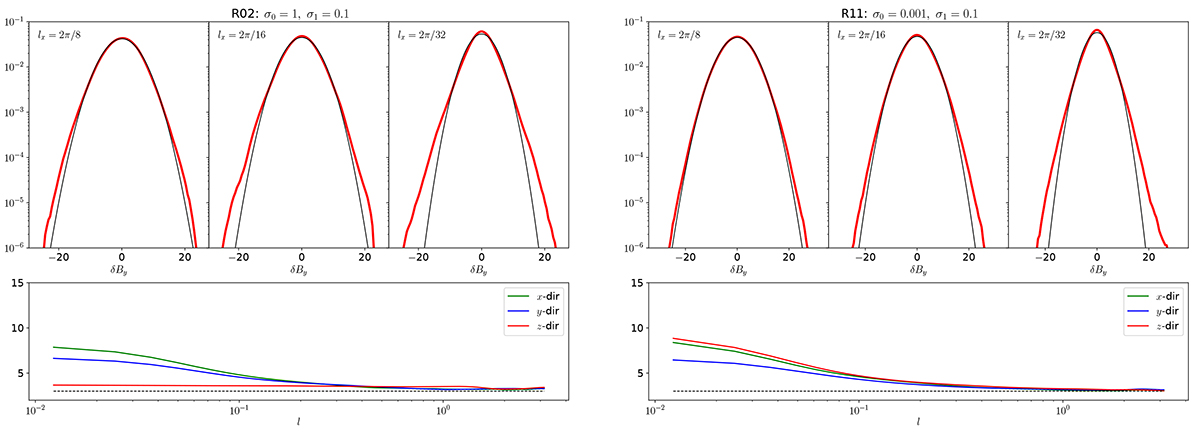
Statistical properties of turbulence for the same runs and output times of Fig. 4. In the top panels, we plot the PDF of δxBy for three different spatial separations, l = 2π/k. In the bottom panels, the kurtosis, 𝒦, is plotted against the separation scale, l, for δiBy, with i = 1, 2, 3.
Current usage metrics show cumulative count of Article Views (full-text article views including HTML views, PDF and ePub downloads, according to the available data) and Abstracts Views on Vision4Press platform.
Data correspond to usage on the plateform after 2015. The current usage metrics is available 48-96 hours after online publication and is updated daily on week days.
Initial download of the metrics may take a while.