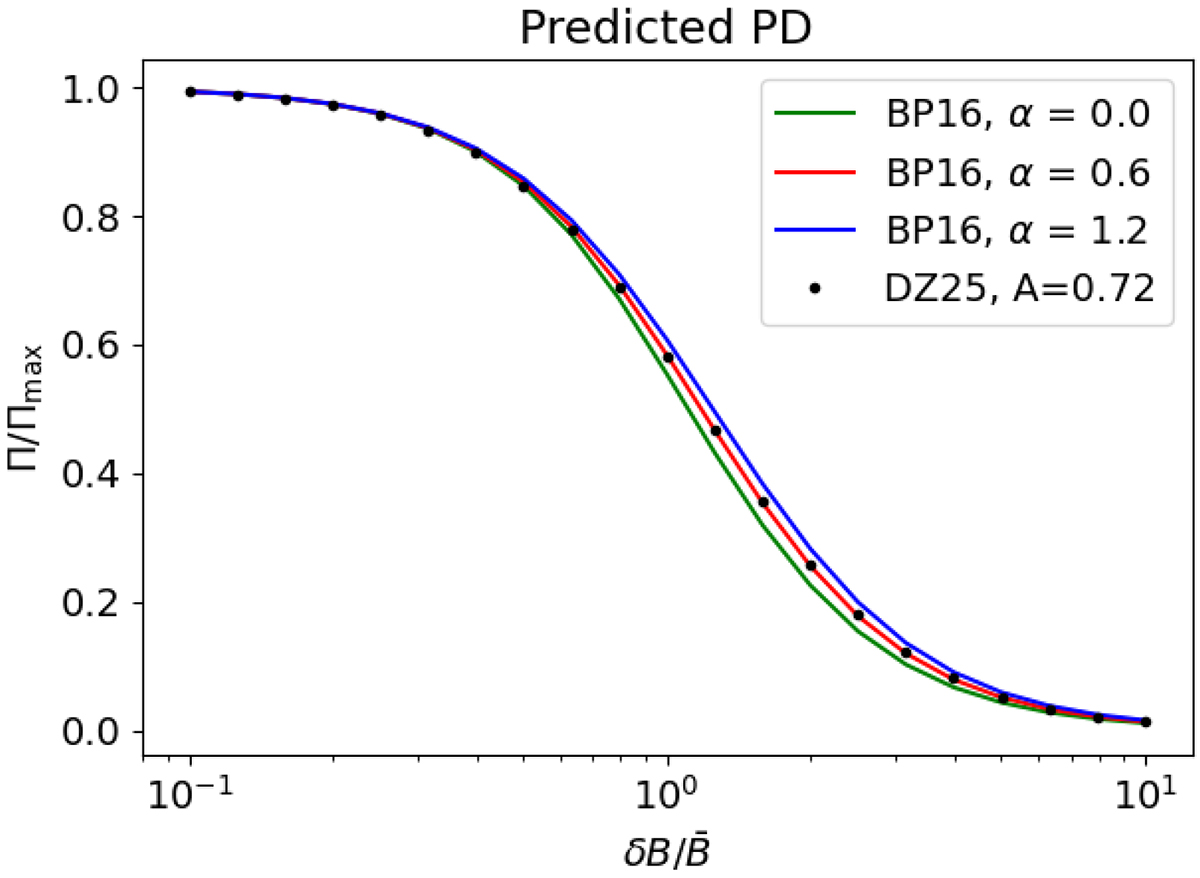
Fig. 7.
Download original image
Comparison of the predicted PD for isotropic Gaussian fluctuations based on confluent hypergeometric functions by Bandiera & Petruk (2016) against our simpler formula in Eq. (14). The expression for A = 0.72 (black dots) fits the BP16 model corresponding to α = 0.6 (the value adopted here, the central red curve) extremely well.
Current usage metrics show cumulative count of Article Views (full-text article views including HTML views, PDF and ePub downloads, according to the available data) and Abstracts Views on Vision4Press platform.
Data correspond to usage on the plateform after 2015. The current usage metrics is available 48-96 hours after online publication and is updated daily on week days.
Initial download of the metrics may take a while.