Fig. 8.
Download original image
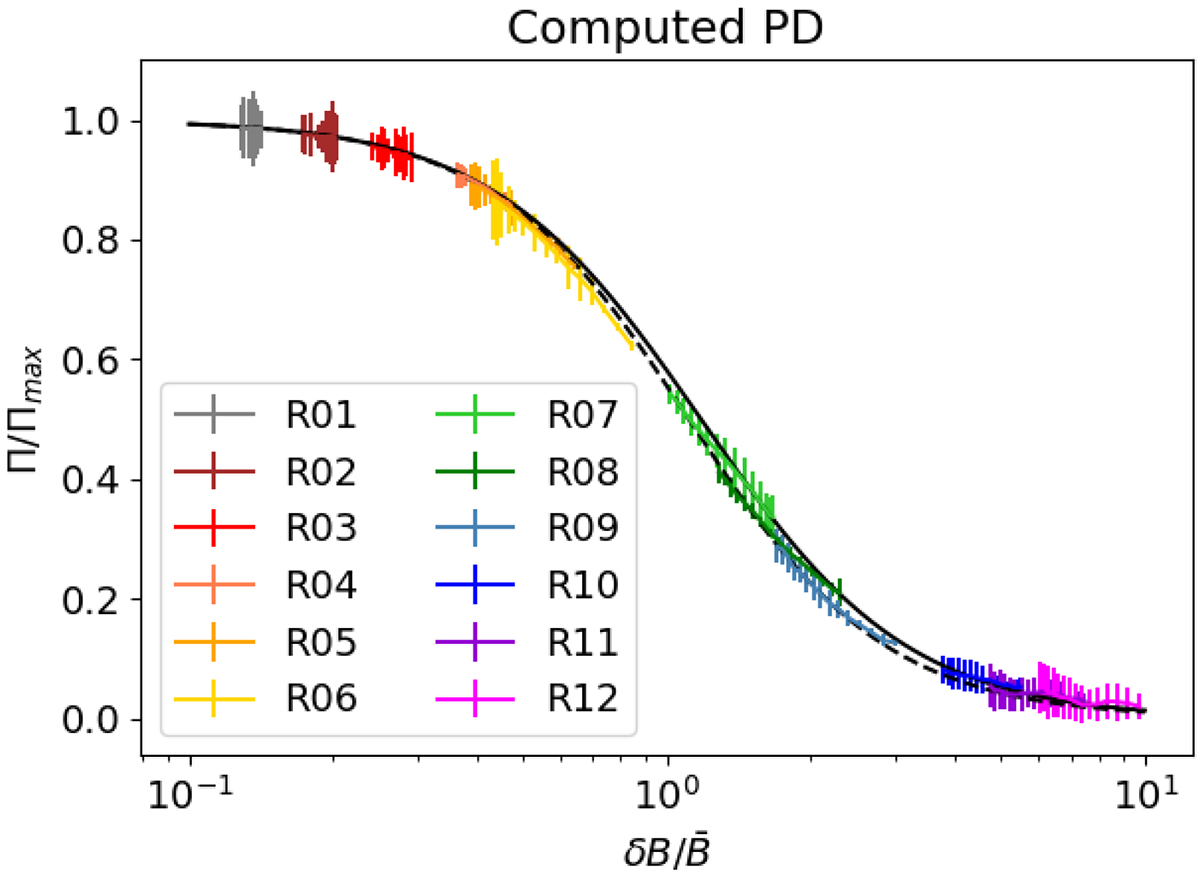
Mean PD computed assuming a guide field in the plane of the sky and perpendicular to LOS (B0 ⊥ n). Results for all 12 runs are shown as function of ![]() , from left to right for increasing values of η, while time increases from right to left, one tick per output. The results basically all lie, within the error bars (estimated from the polarization along B0), on the solid black line, corresponding to the DZ25 model with A = 0.72, as shown in Fig. 7. The dashed black line is an analytical improved estimate, basically obtained by increasing A of ≈15%, to take anisotropy of fluctuations into account (see the text and Appendix A).
, from left to right for increasing values of η, while time increases from right to left, one tick per output. The results basically all lie, within the error bars (estimated from the polarization along B0), on the solid black line, corresponding to the DZ25 model with A = 0.72, as shown in Fig. 7. The dashed black line is an analytical improved estimate, basically obtained by increasing A of ≈15%, to take anisotropy of fluctuations into account (see the text and Appendix A).
Current usage metrics show cumulative count of Article Views (full-text article views including HTML views, PDF and ePub downloads, according to the available data) and Abstracts Views on Vision4Press platform.
Data correspond to usage on the plateform after 2015. The current usage metrics is available 48-96 hours after online publication and is updated daily on week days.
Initial download of the metrics may take a while.