Fig. 9.
Download original image
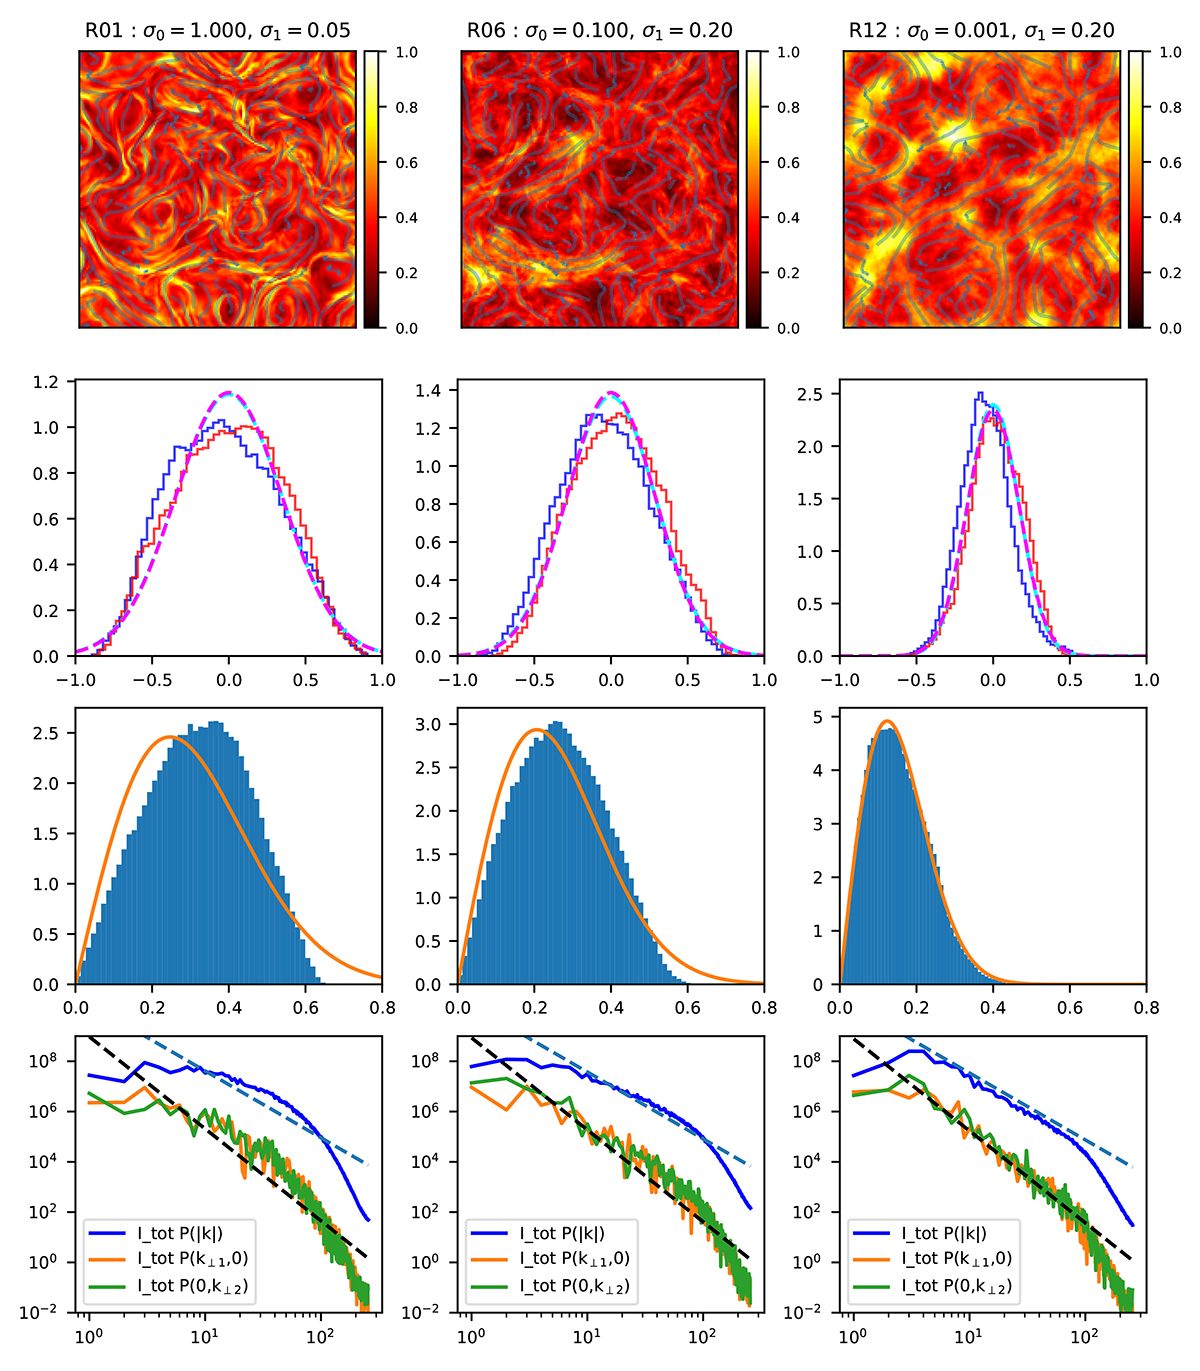
Synchrotron properties for the case of a mean field along the LOS (B0 ∥ n), for cases R01 (t = 60), R06 (t = 10), and R12, (t = 10). Upper row: Total synchrotron intensity normalized to the maximum, overlaid with the synchrotron magnetic fieldlines (cyan curves) estimated from Stokes parameters. Second row: Distribution function of Stokes parameters Q/I (blue) and U/I (red) together with 0-mean Gaussian distribution with the same variance (cyan and magenta respectively), normalized to Πmax. Third Row: Distribution function of the PD, together with the Rice function with variance derived from Stokes. Fourth row: Spectral properties of the total intensity, compared with the theoretical expectation for Kolmogorov turbulence both on-shell ∝k−8/3 (dashed blue) and in the x and y directions in k space ∝k−11/3 (dashed black).
Current usage metrics show cumulative count of Article Views (full-text article views including HTML views, PDF and ePub downloads, according to the available data) and Abstracts Views on Vision4Press platform.
Data correspond to usage on the plateform after 2015. The current usage metrics is available 48-96 hours after online publication and is updated daily on week days.
Initial download of the metrics may take a while.