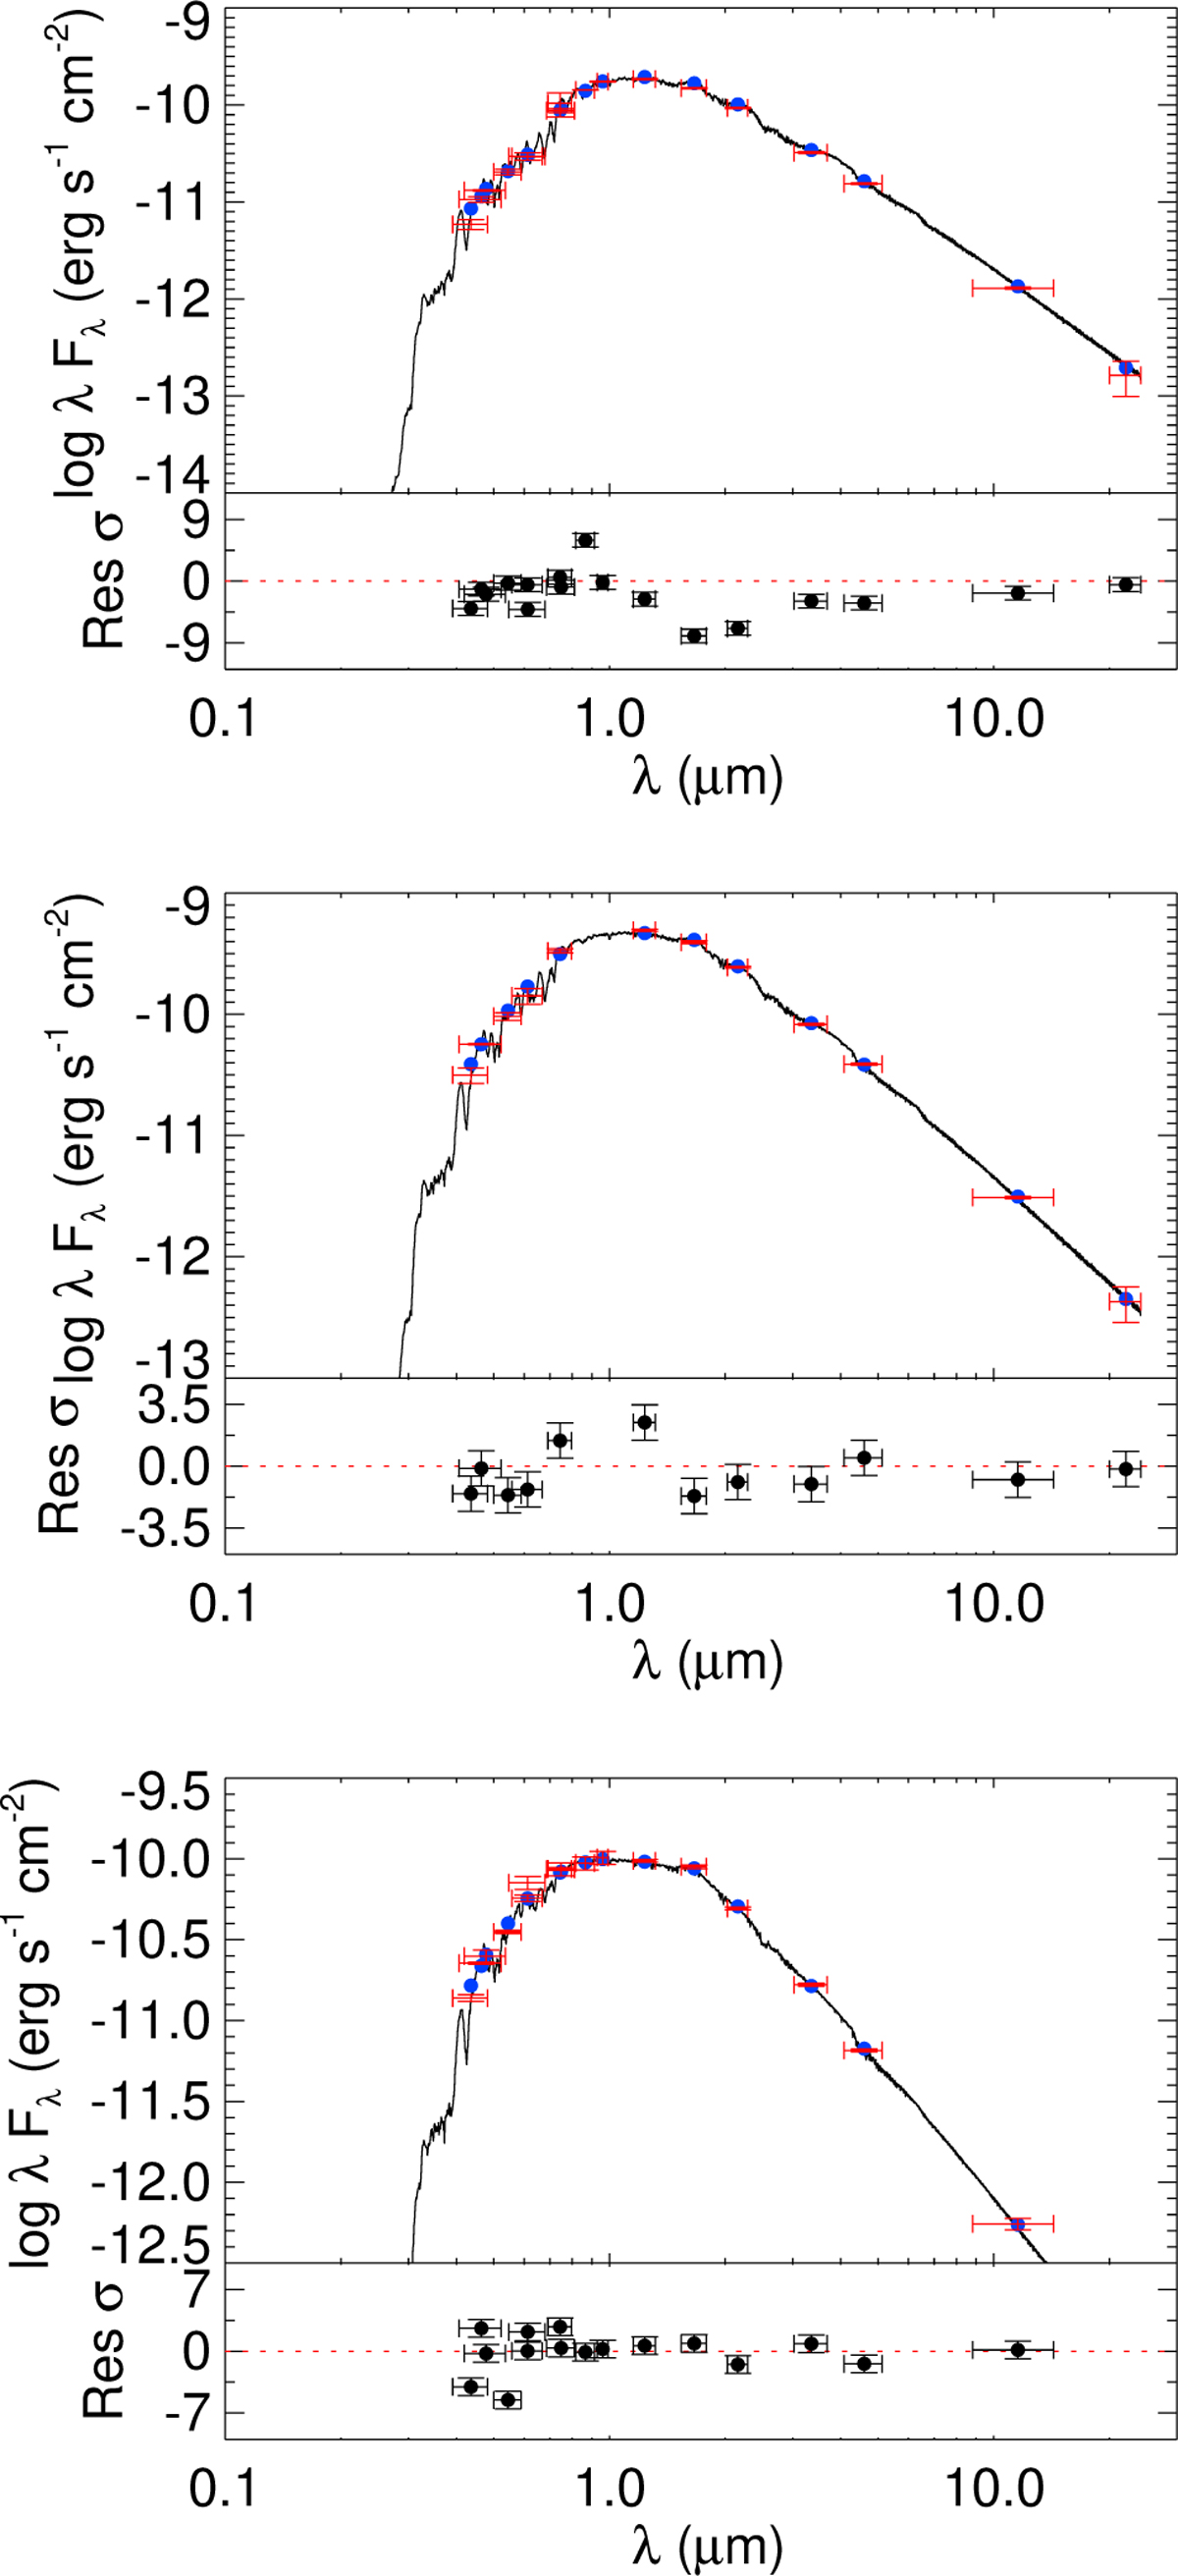
Fig. C.1
Download original image
SED models (black lines) of host stars (from top to bottom: TOI-1743, TOI-5799, and TOI-6223). The red dots with error bars represent the broadband fluxes, while their corresponding model values are shown as blue dots. The horizontal red bars show the bandwidths of filters. Residuals are shown in the lower panel for each plot in σ units.
Current usage metrics show cumulative count of Article Views (full-text article views including HTML views, PDF and ePub downloads, according to the available data) and Abstracts Views on Vision4Press platform.
Data correspond to usage on the plateform after 2015. The current usage metrics is available 48-96 hours after online publication and is updated daily on week days.
Initial download of the metrics may take a while.