Fig. 4
Download original image
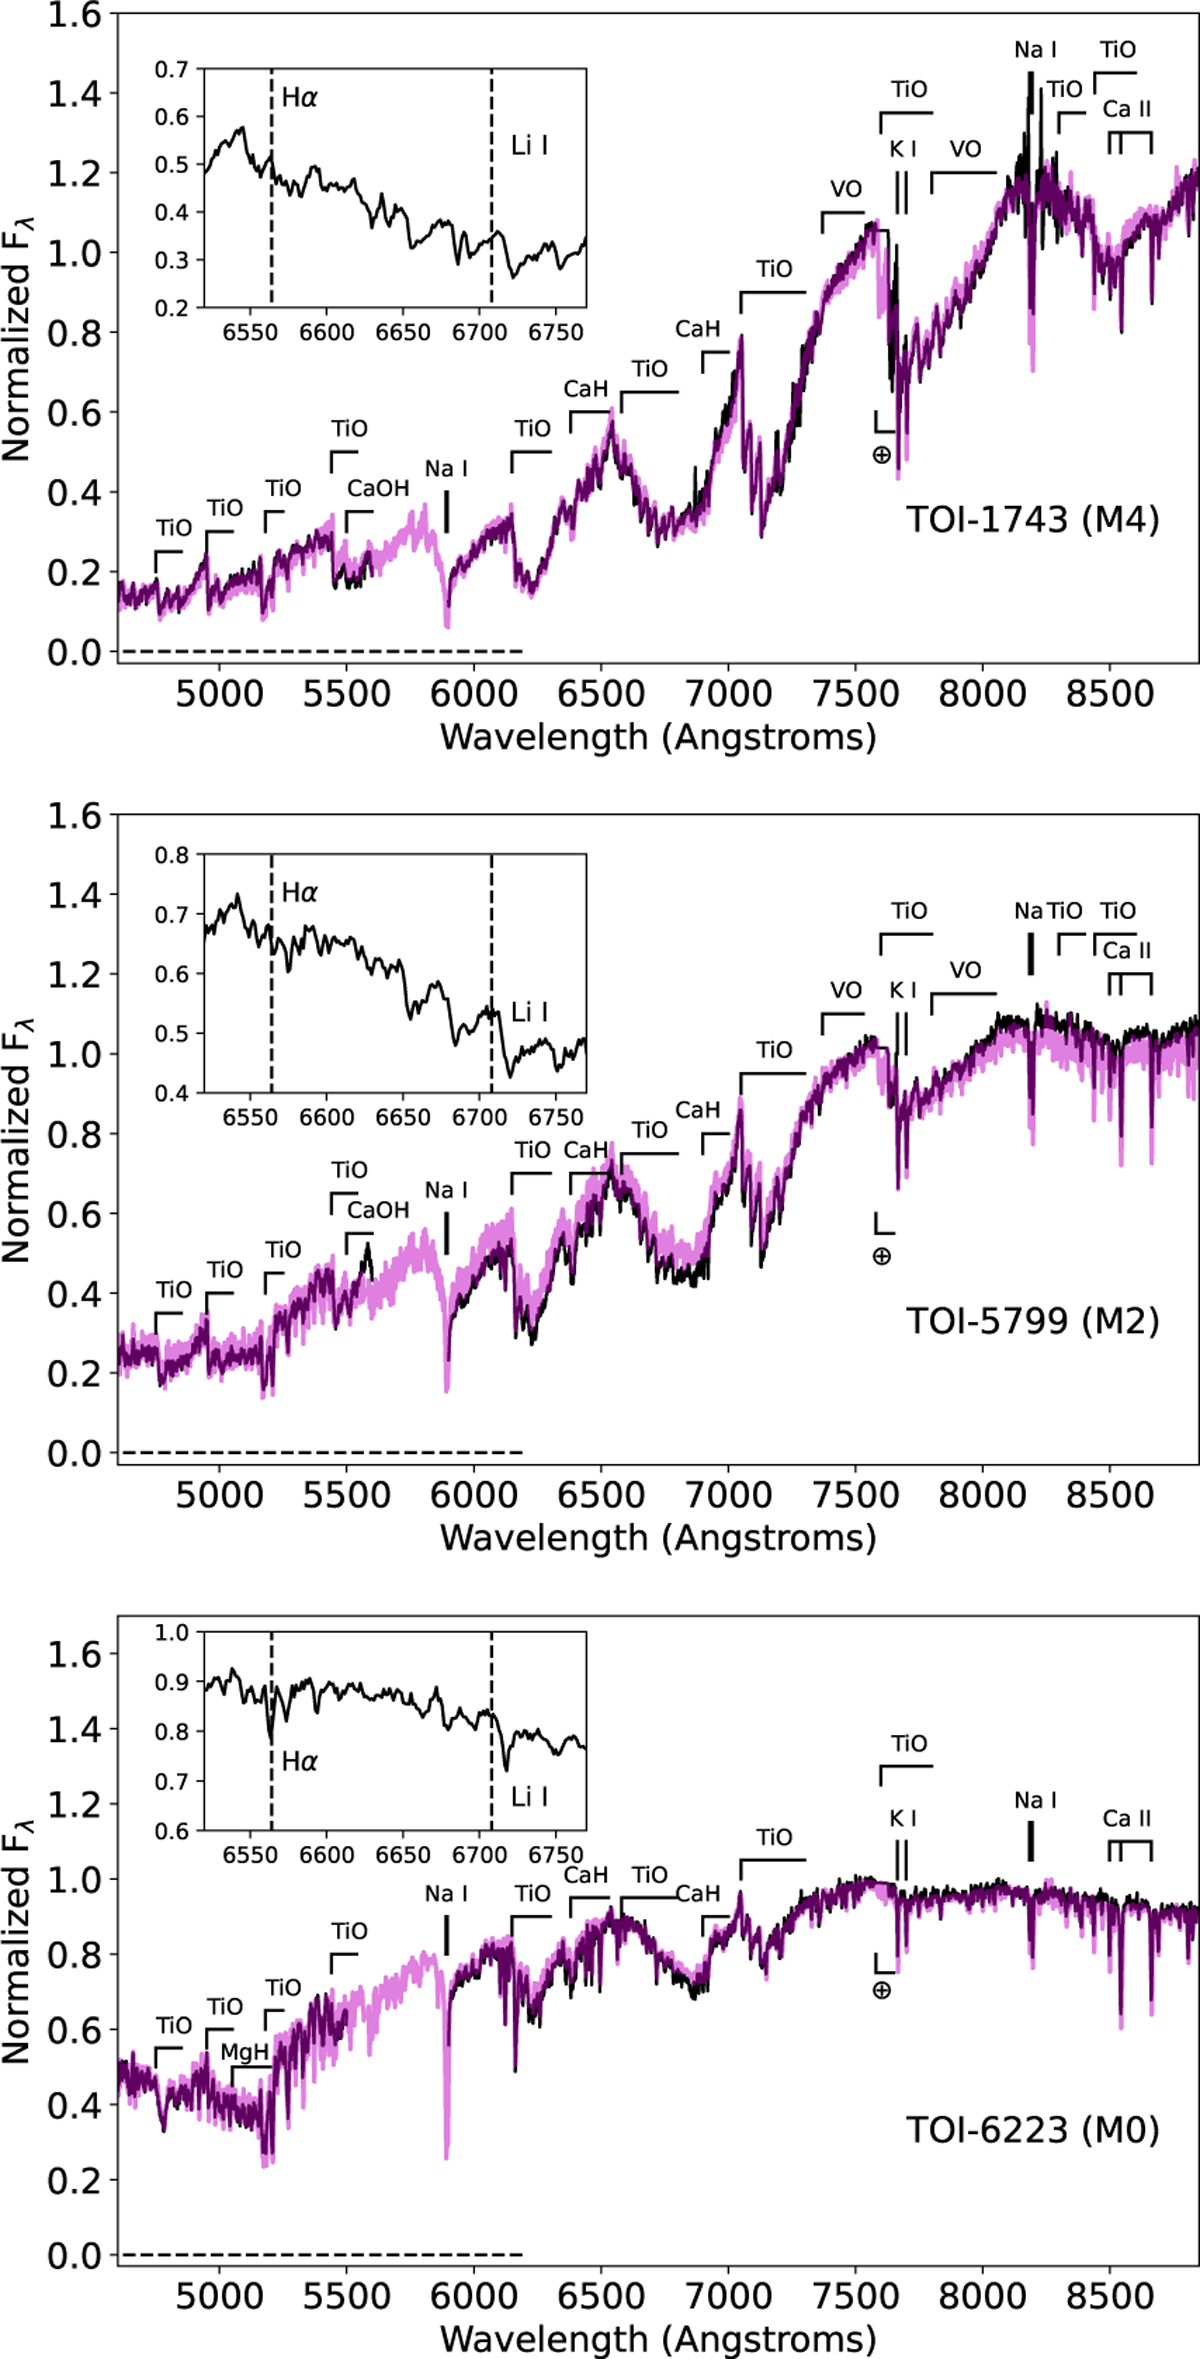
Shane/Kast optical spectra (black lines, normalized at 7400 Å) of (from top to bottom): TOI-1743, TOI-5799, and TOI-6223. Best-fit SDSS standard templates (Bochanski et al. 2007) are shown as magenta lines. The key spectral features in the range 4200–8900 A are labeled, including the location of the (corrected) O2 telluric A-band at 7500 Å (⊕). The zoomed-in regions around the 6563 Å Hα and 6708 Å Li I lines are shown in the insets. The 5600–5900 Å gap is due to the dichroic separation between the blue and red channels of the Kast spectrograph.
Current usage metrics show cumulative count of Article Views (full-text article views including HTML views, PDF and ePub downloads, according to the available data) and Abstracts Views on Vision4Press platform.
Data correspond to usage on the plateform after 2015. The current usage metrics is available 48-96 hours after online publication and is updated daily on week days.
Initial download of the metrics may take a while.