Fig. 1
Download original image
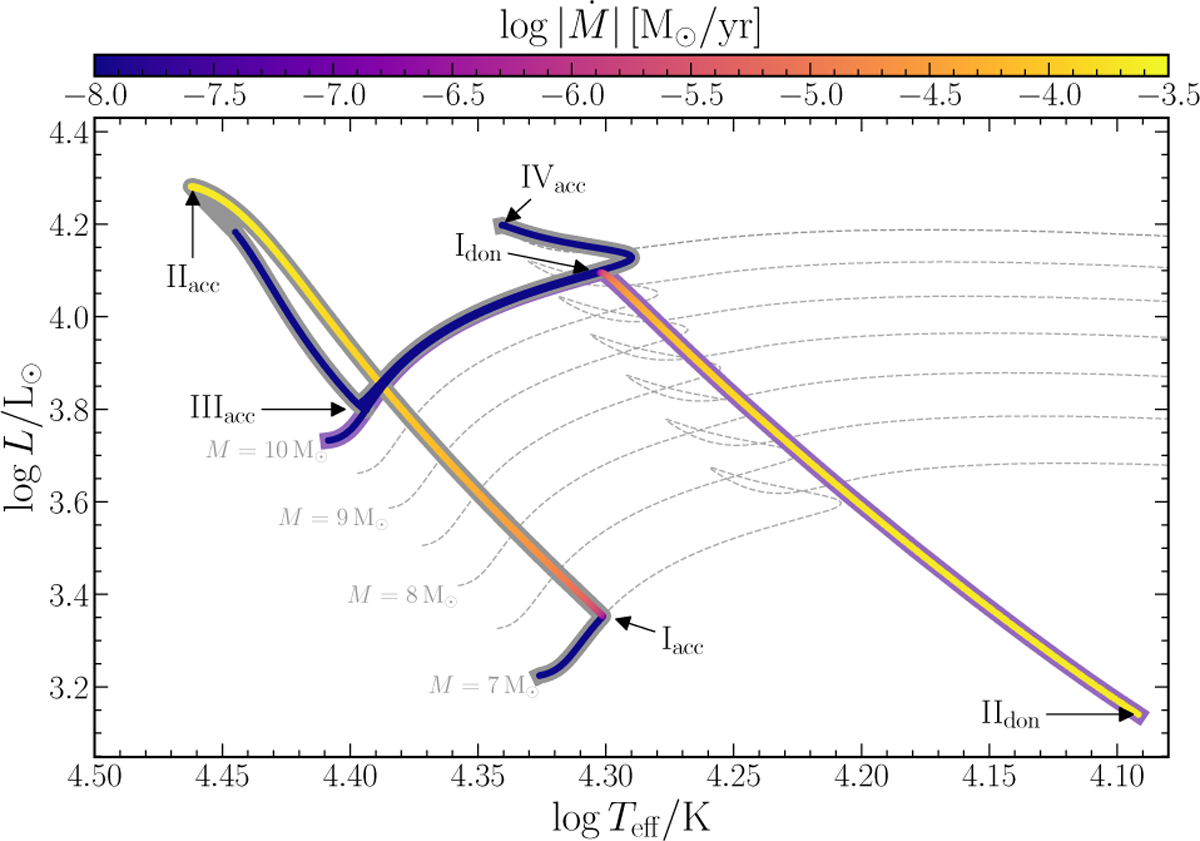
The HR diagram with the evolutionary tracks of the binary system components. The donor star is shown with the purple line and the accretor with the gray line, both plotted alongside single-star reference models for different masses (dashed lines). The mass transfer/accretion rate, log |·M|, is overplotted along the tracks using colour coding, as indicated by the colour bar. The key evolutionary changes are marked: the donor fills its Roche lobe and begins mass transfer (Idon), the accretor starts to gain mass and departs from its original track (Iacc), full mass ratio reversal when the accretor reaches 10 M☉ and the following detachment of the system (IIacc and IIdon), thermal readjustment of the accretor (IIIacc), and the accretor's single-star evolution until the end of the main sequence (I Vacc).
Current usage metrics show cumulative count of Article Views (full-text article views including HTML views, PDF and ePub downloads, according to the available data) and Abstracts Views on Vision4Press platform.
Data correspond to usage on the plateform after 2015. The current usage metrics is available 48-96 hours after online publication and is updated daily on week days.
Initial download of the metrics may take a while.