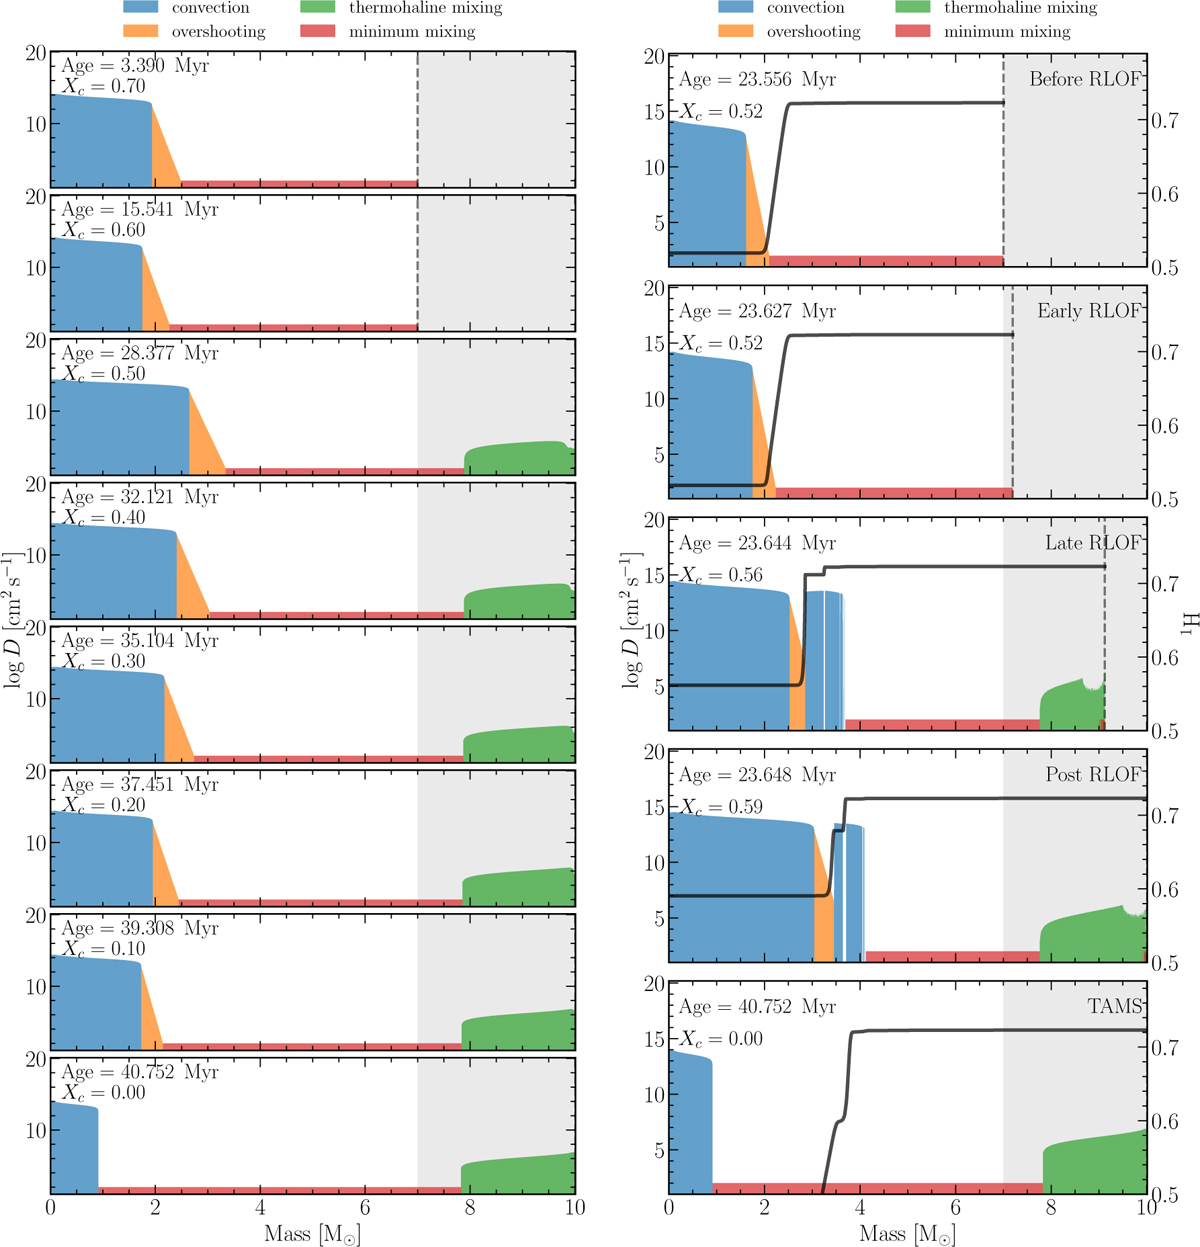
Fig. 3
Download original image
Mixing profiles, D, during the evolution of the accretor. Left: evolution from Xc=0.7 to 0.0 in steps of 0.1. Right: profiles at selected evolutionary stages, before, during and after the RLOF. The shaded areas indicate the regions over which the mass varies, with the current mass indicated by dashed lines. The black lines, as denoted on the right-hand ordinates of the right panels show the corresponding profiles of hydrogen abundances.
Current usage metrics show cumulative count of Article Views (full-text article views including HTML views, PDF and ePub downloads, according to the available data) and Abstracts Views on Vision4Press platform.
Data correspond to usage on the plateform after 2015. The current usage metrics is available 48-96 hours after online publication and is updated daily on week days.
Initial download of the metrics may take a while.