Fig. 8
Download original image
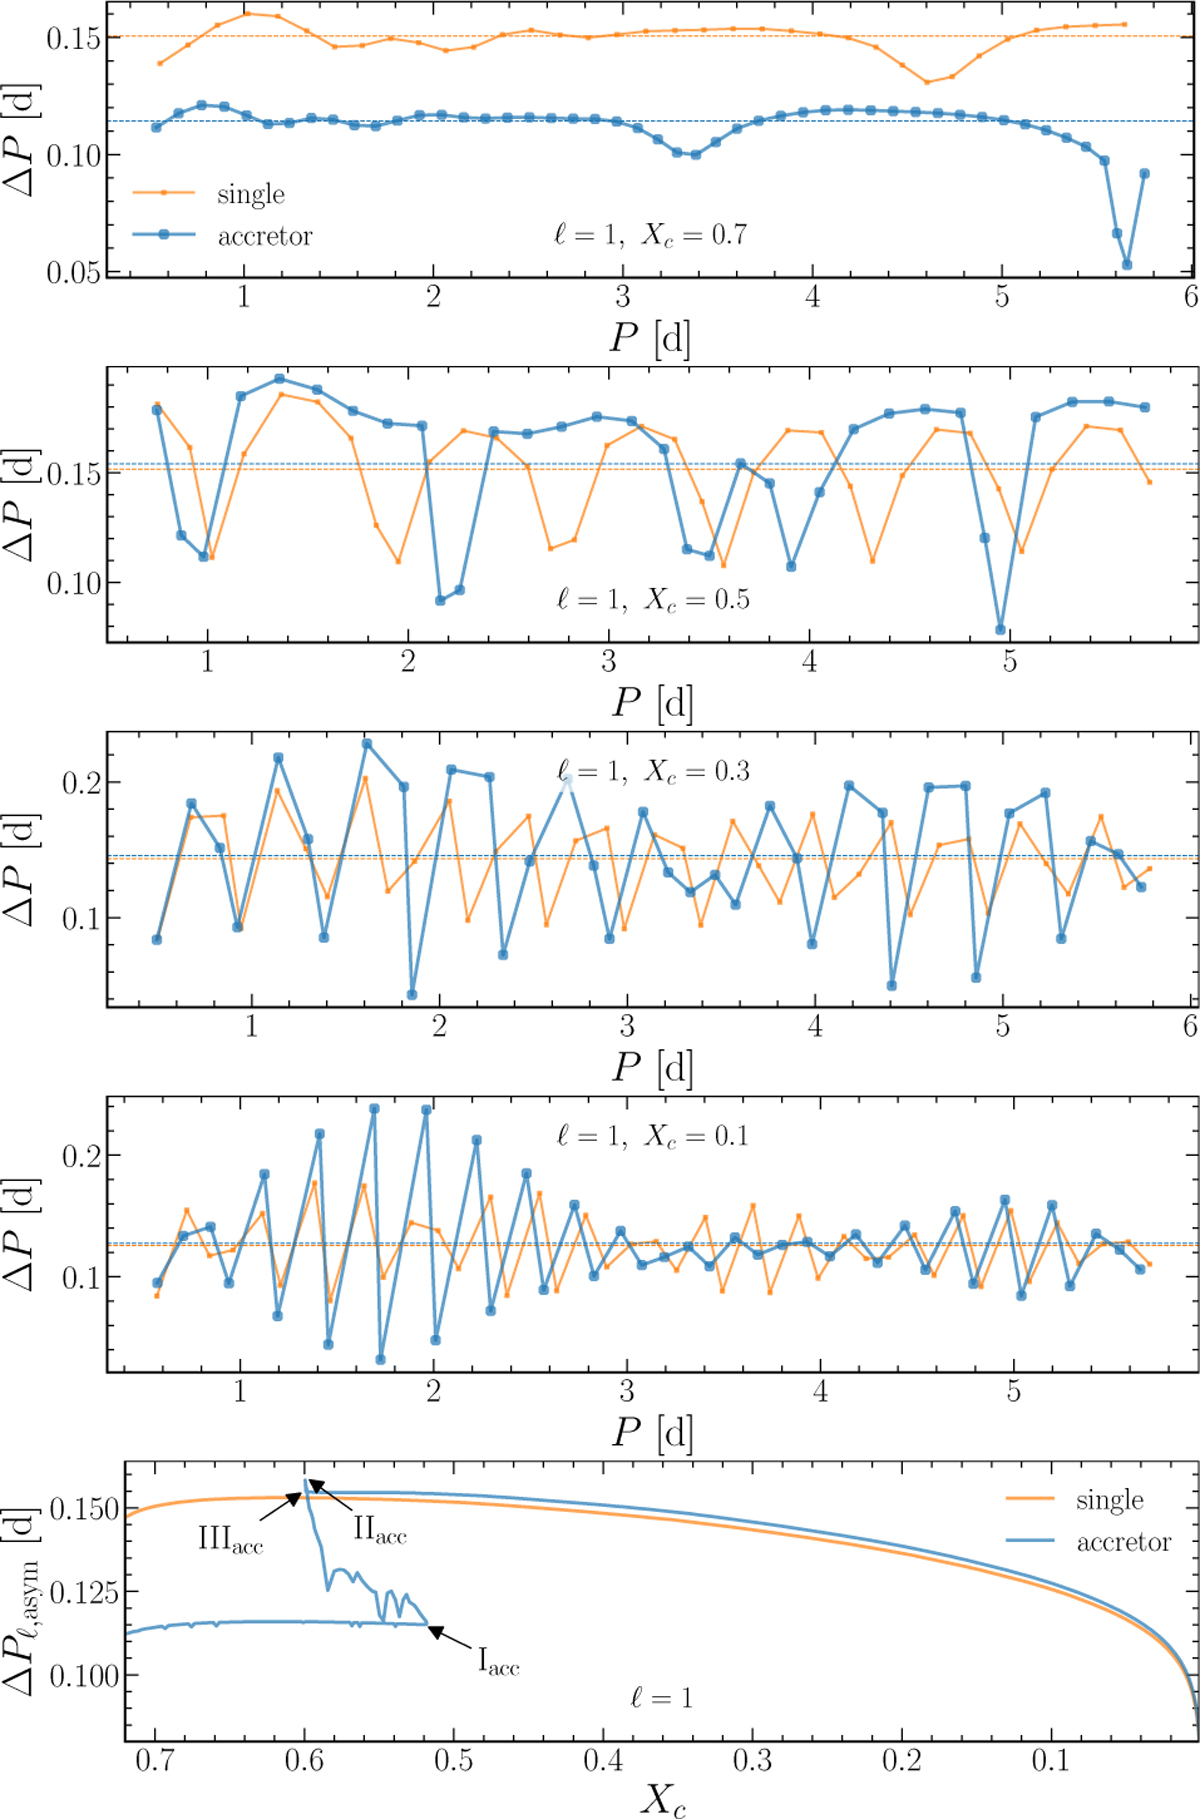
Period spacing diagrams showing dipole g modes, for both the accretor model (orange line) and the single-star model (blue line). The horizontal lines mark the asymptotic value of the period spacing. We show results for only four different evolutionary stages, Xc= 0.7, 0.5, 0.3, and 0.1. The bottom panel shows the comparison of the ℓ=1 asymptotic period spacing evolution between the accretor and the single model. We mark points corresponding to key evolutionary changes of the accretor according to Figure 1.
Current usage metrics show cumulative count of Article Views (full-text article views including HTML views, PDF and ePub downloads, according to the available data) and Abstracts Views on Vision4Press platform.
Data correspond to usage on the plateform after 2015. The current usage metrics is available 48-96 hours after online publication and is updated daily on week days.
Initial download of the metrics may take a while.