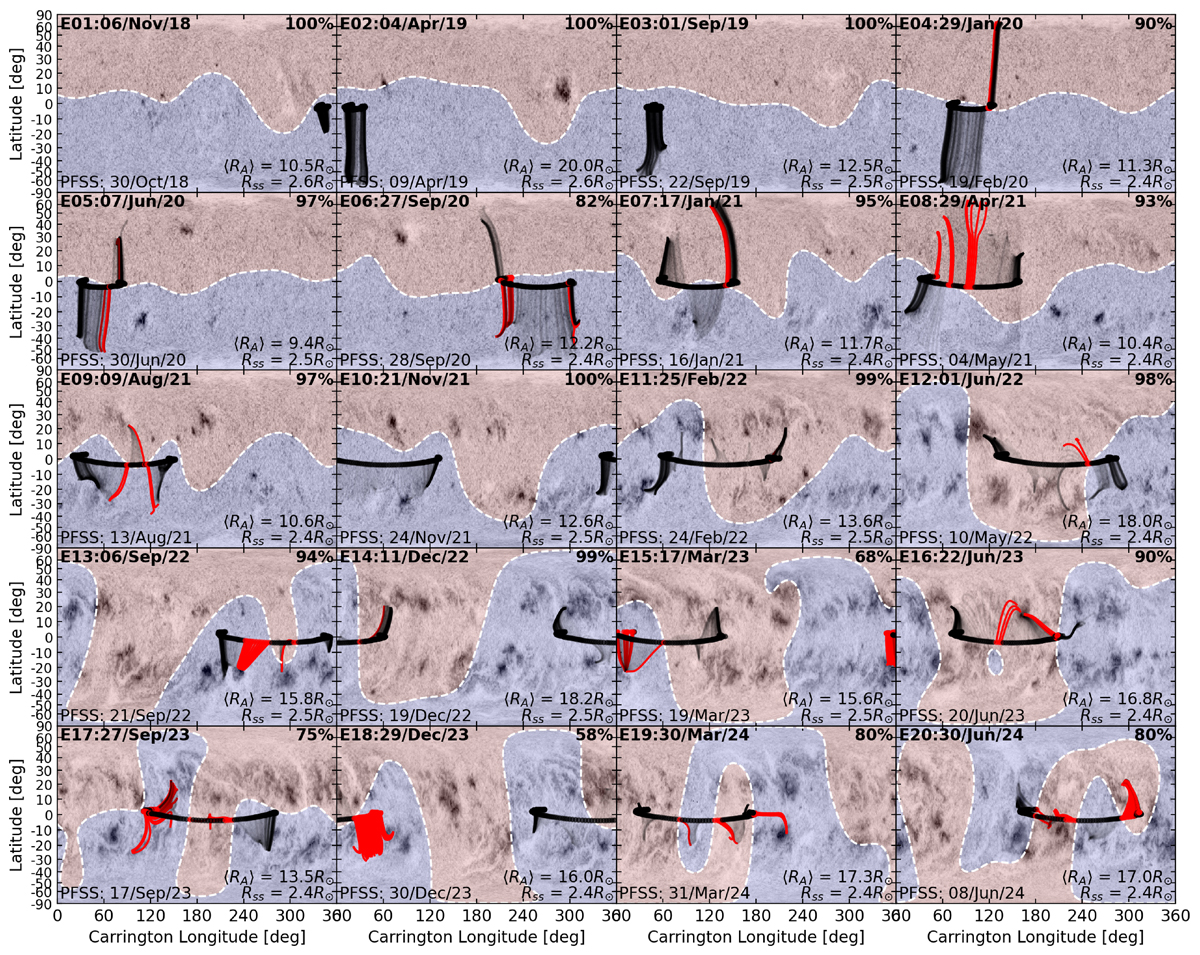
Fig. B.2.
Download original image
Similar to Fig. B.1 but now showing the PFSS magnetic field lines from PSP to the solar surface coloured red when the predicted magnetic field polarity does not match the in situ measurement. The grey scale shows Carrington maps of SDO/AIA 304Å emission. The fraction of hourly magnetic field polarity that matched the PFSS model is given in the upper-right corner for each encounter.
Current usage metrics show cumulative count of Article Views (full-text article views including HTML views, PDF and ePub downloads, according to the available data) and Abstracts Views on Vision4Press platform.
Data correspond to usage on the plateform after 2015. The current usage metrics is available 48-96 hours after online publication and is updated daily on week days.
Initial download of the metrics may take a while.