Fig. 3.
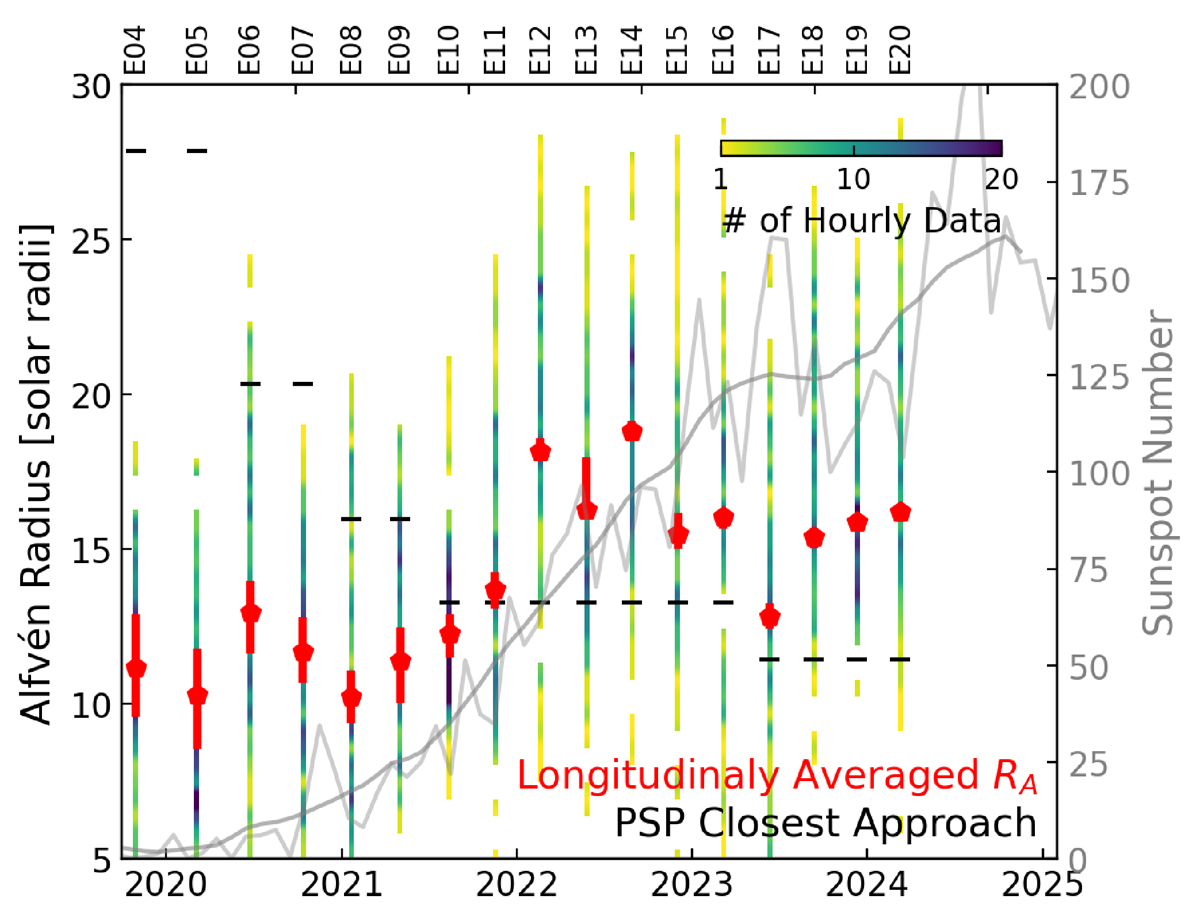
Download original image
Evolution of the Alfvén radius extrapolated from PSP over solar cycle 25. The horizontal black ticks show PSP’s closest approach in each encounter. The distribution of hourly extrapolations using α = 0.1 is shown with coloured histograms. The longitudinally averaged value for each encounter is indicated with a red marker. The associated red bars show the variation in the average due to different wind accelerations (from α = 0 to α = 0.2). The thin and thick grey lines represent the monthly and monthly smoothed sunspot number from WDC-SILSO.
Current usage metrics show cumulative count of Article Views (full-text article views including HTML views, PDF and ePub downloads, according to the available data) and Abstracts Views on Vision4Press platform.
Data correspond to usage on the plateform after 2015. The current usage metrics is available 48-96 hours after online publication and is updated daily on week days.
Initial download of the metrics may take a while.