Fig. 5.

Download original image
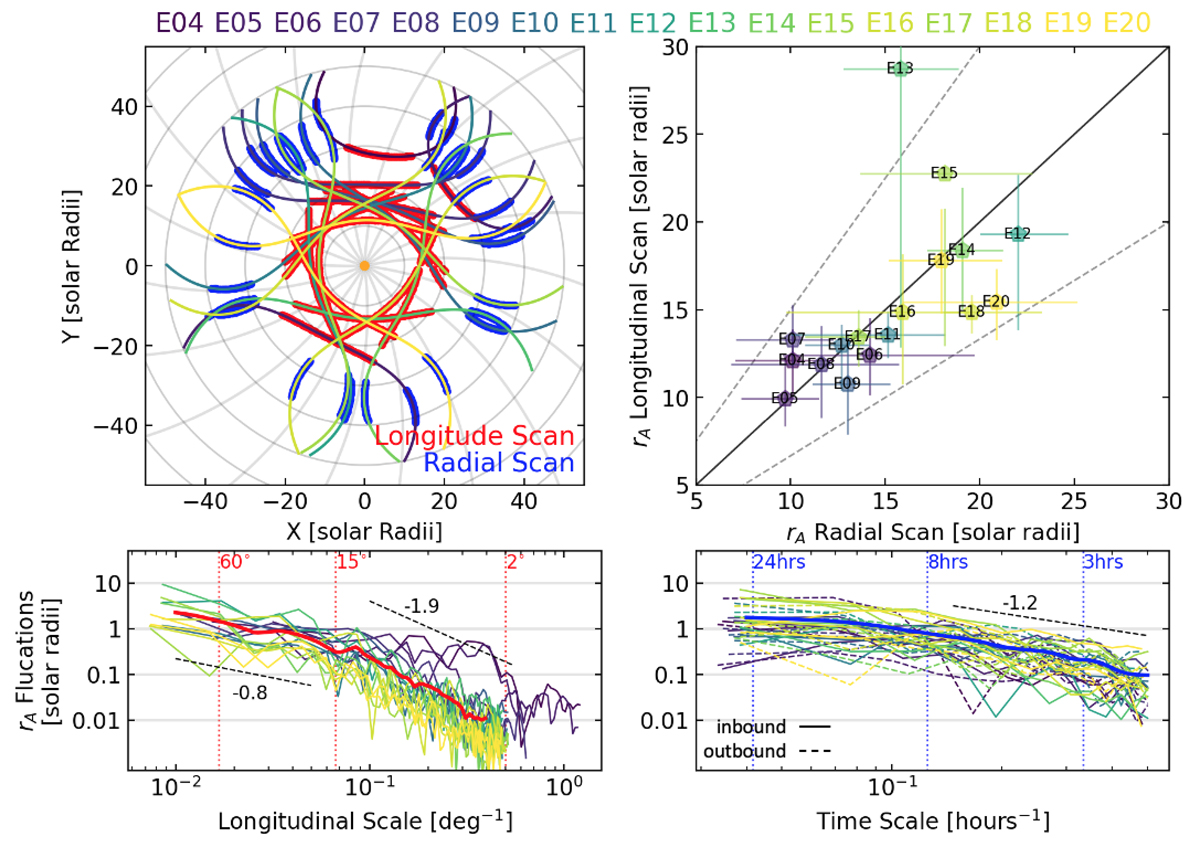
Fluctuations in the Sun’s Alfvén radius during PSP’s longitudinal and radial scans. Encounters are coloured by monthly sunspot number. Top left: PSP’s trajectory in the Carrington frame from E04 to E20, when PSP was below 50 solar radii. The segments highlighted in red at closest approach correspond to the longitudinal scans. The segments highlighted in blue correspond to the radial scans, when PSP moved quasi-radially in the Carrington frame. Top right: Markers, labelled by encounter, show the 50th percentile of the Alfvvn radii measured during the longitudinal and radial scans. Vertical and horizontal lines represent the 25th to 75th percentiles during the longitudinal and radial scans, respectively. The solid line marks equality, and the dashed lines highlight ± a third. Bottom: Longitudinal scan and radial scans decomposed with discrete Fourier transforms to identify the spatial and temporal scales associated with the variation in the Alfvén radius away from the average (rA − ⟨rA⟩). Thick solid lines show the averaged profile for all encounters except E04 and E05.
Current usage metrics show cumulative count of Article Views (full-text article views including HTML views, PDF and ePub downloads, according to the available data) and Abstracts Views on Vision4Press platform.
Data correspond to usage on the plateform after 2015. The current usage metrics is available 48-96 hours after online publication and is updated daily on week days.
Initial download of the metrics may take a while.


