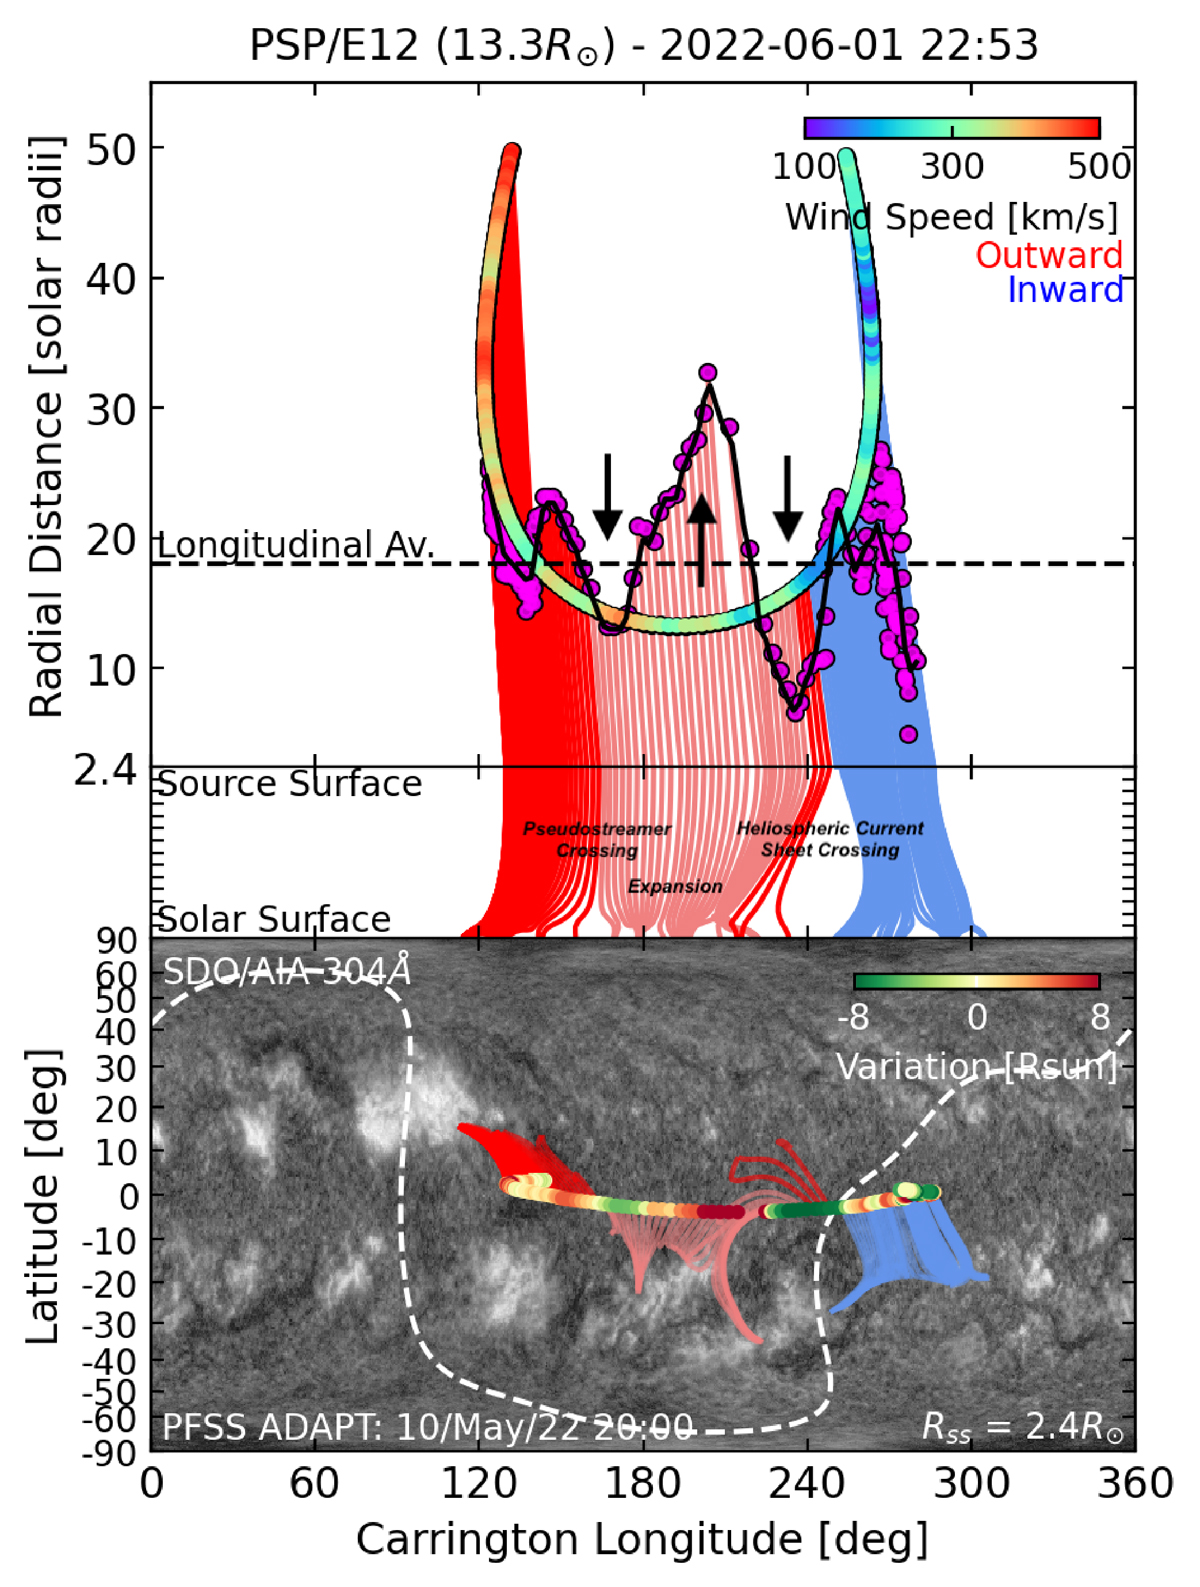
Fig. 6.
Download original image
Mapping the solar wind from PSP to the Sun during E12 in June 2022. Top: Solar wind speed at PSP with magnetic field lines traced down to the solar surface using a Parker spiral and PFSS model. Field lines connecting to the southern hemisphere are distinguished with a lighter colour. Magenta points show the Alfvén radius for each hourly extrapolation, and the solid black line shows these points binned in longitude. The longitudinal average is highlighted with a dashed horizontal line. Bottom: Carrington map of SDO/AIA 304 Å emission in grey scale with the heliospheric current sheet over-plotted with a dashed white line. Coloured markers show the variation in the Alfvén radius away from the longitudinal average. Magnetic field lines connect these points to their sources.
Current usage metrics show cumulative count of Article Views (full-text article views including HTML views, PDF and ePub downloads, according to the available data) and Abstracts Views on Vision4Press platform.
Data correspond to usage on the plateform after 2015. The current usage metrics is available 48-96 hours after online publication and is updated daily on week days.
Initial download of the metrics may take a while.