Fig. 8.
Download original image
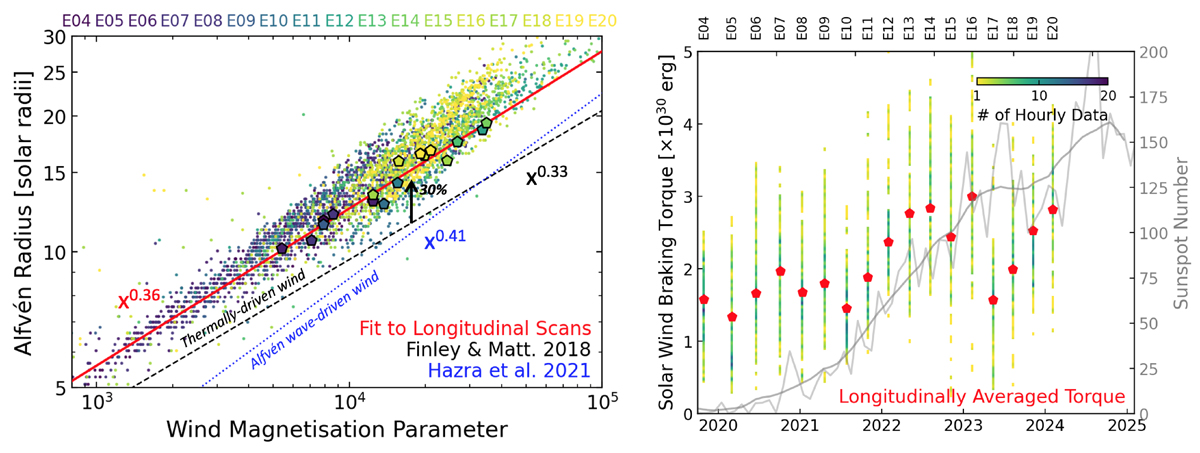
Dependence of the Alfvén radius on the wind magnetisation, and the time-evolution of the Sun’s wind braking torque. Left: Longitudinally averaged Alfvén radii shown with large markers coloured by the monthly sunspot number. The solid red line is the fit to those points. The dashed and dotted lines compare the predicted scaling based on 2.5D wind simulations from Finley & Matt (2018) and Hazra et al. (2021), respectively. The hourly Alfvén radii from each encounter are scattered in the background with the corresponding colour. Right: Same as Fig. 3 but now for the solar wind angular momentum-loss rate.
Current usage metrics show cumulative count of Article Views (full-text article views including HTML views, PDF and ePub downloads, according to the available data) and Abstracts Views on Vision4Press platform.
Data correspond to usage on the plateform after 2015. The current usage metrics is available 48-96 hours after online publication and is updated daily on week days.
Initial download of the metrics may take a while.