Open Access
Fig. 5
Download original image
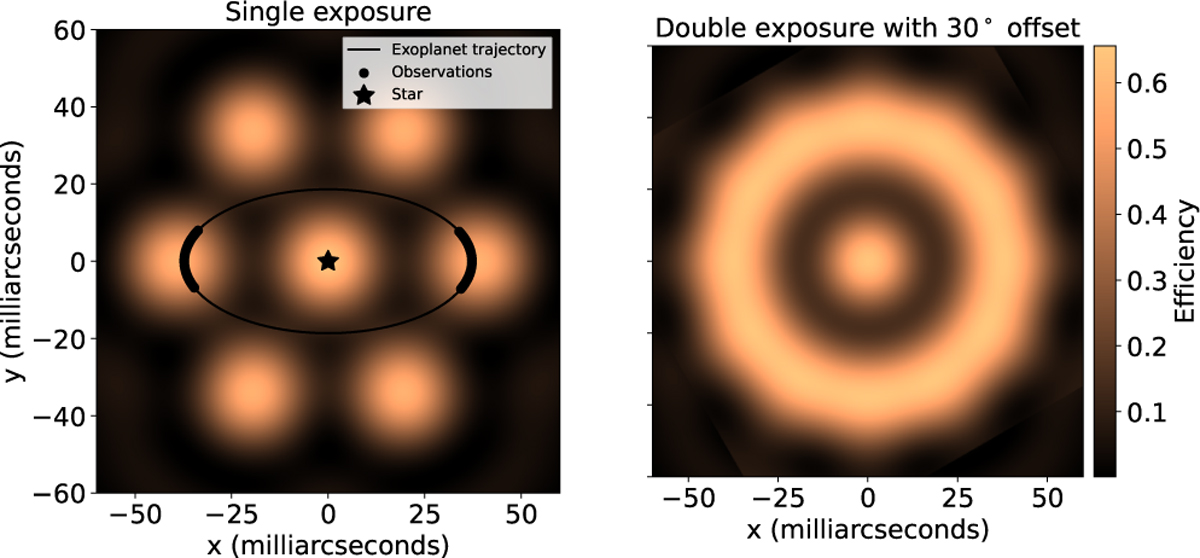
Left panel: IFU transmission map into the 7 fibers for single orientation, with the trajectory of Proxima b overlaid on top. Right panel: IFU transmission combining 2 exposures with a 30° offset. For both plots, we assumed median seeing (0.76″) and elevation (43°) conditions, and λ = 840 nm.
Current usage metrics show cumulative count of Article Views (full-text article views including HTML views, PDF and ePub downloads, according to the available data) and Abstracts Views on Vision4Press platform.
Data correspond to usage on the plateform after 2015. The current usage metrics is available 48-96 hours after online publication and is updated daily on week days.
Initial download of the metrics may take a while.